Sonic (SUSD) Faces Persistent Downtrend Despite Minor Rebound Attempt
Estimated Reading Time: 4 minutes
Don’t invest unless you’re prepared to lose all the money you invest. This is a high-risk investment and you are unlikely to be protected if something goes wrong. Take 2 minutes to learn more
Amid continued geopolitical tensions weighing heavily on the broader cryptocurrency market, the Sonic (SUSD) market has not been spared. The asset remains firmly in a downtrend, with price action consistently reflecting bearish momentum.
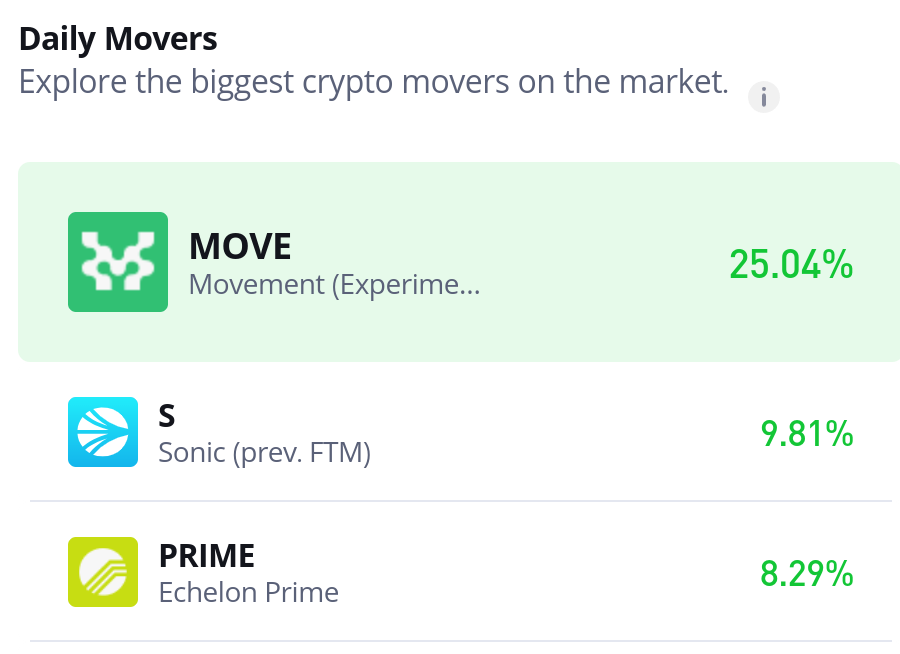
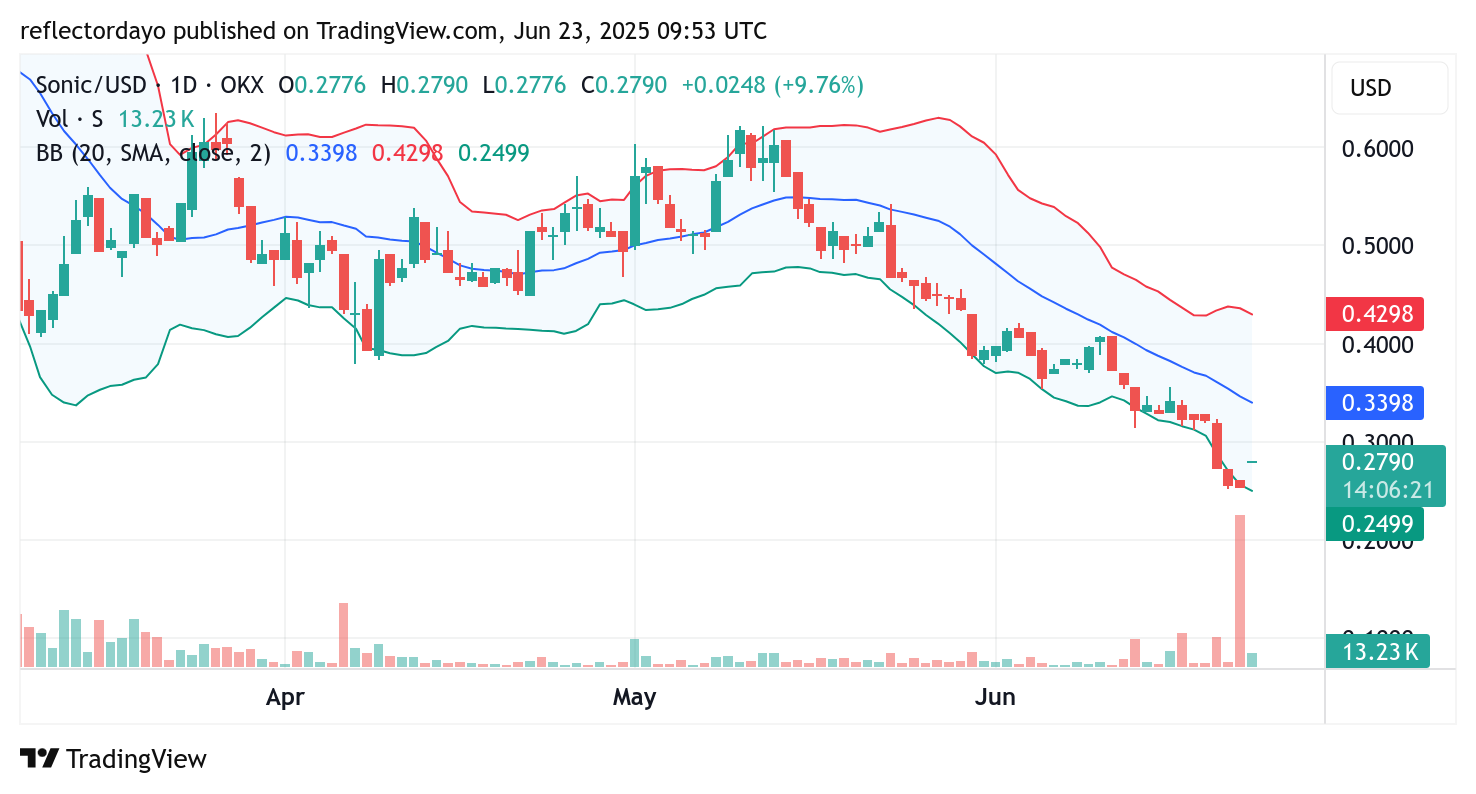
However, SUSD briefly emerged among the top daily movers, registering a modest 9.8% gain over the past 24 hours. Despite this short-term recovery, the broader trend remains negative. Since May, SUSD has been trading below its 20-day moving average, which continues to slope downward—an indication of sustained selling pressure.
The market has declined from highs near the $0.60 range and is now approaching the $0.20 threshold. This marginal bounce may be seen as a weak attempt at recovery rather than a definitive trend reversal. Without a strong catalyst or shift in market sentiment, Sonic (SUSD) remains vulnerable to further downside in the near term.
Sonic Market Data
S/USD Price Now: $0.28
S/USD Market Cap: $805 million
S/USD Circulating Supply: 2.8 billion
S/USD Total Supply: 3 billion
S/USD CoinMarketCap Ranking: #76
Key Levels
- Resistance: $0.30, $0.35, and $0.40
- Support: $0.20, $0.15, and $0.10
Sonic (SUSD) Market Outlook: Signs of a Potential Rebound Amid Low Price Consolidation
In the previous daily trading session, some traders and analysts identified early signs of a potential rebound in the Sonic (SUSD) market. This optimism stemmed from a significant spike in trading volume, evidenced by a tall volume histogram—indicating a surge in investor interest. Despite this uptick in activity, the price remained largely unchanged, suggesting a strong standoff between buyers and sellers.
The fact that this faceoff occurred at a low price zone—typically considered bullish territory—signals that the ongoing bearish trend may be losing momentum. The inability of the bears to push prices further down despite increased volume hints at weakening selling pressure.
However, today’s trading session paints a more subdued picture. Trading activity has dropped notably, and price action remains stagnant at approximately $0.279. While some bullish undertones are emerging, the market is still trading below the downward-sloping 20-day moving average, which continues to reflect the dominant bearish trend.
For a convincing recovery to take hold, the market must break above the $0.30 resistance level. A breakout at this point would likely draw more attention to SUSD and may serve as a trigger for renewed bullish momentum. Until then, the sustainability of any recovery remains uncertain, and a clear confirmation of trend reversal is still required.

Sonic (SUSD) 4-Hour Chart: Market Stalls at $0.28 as Traders Await Breakout Signal
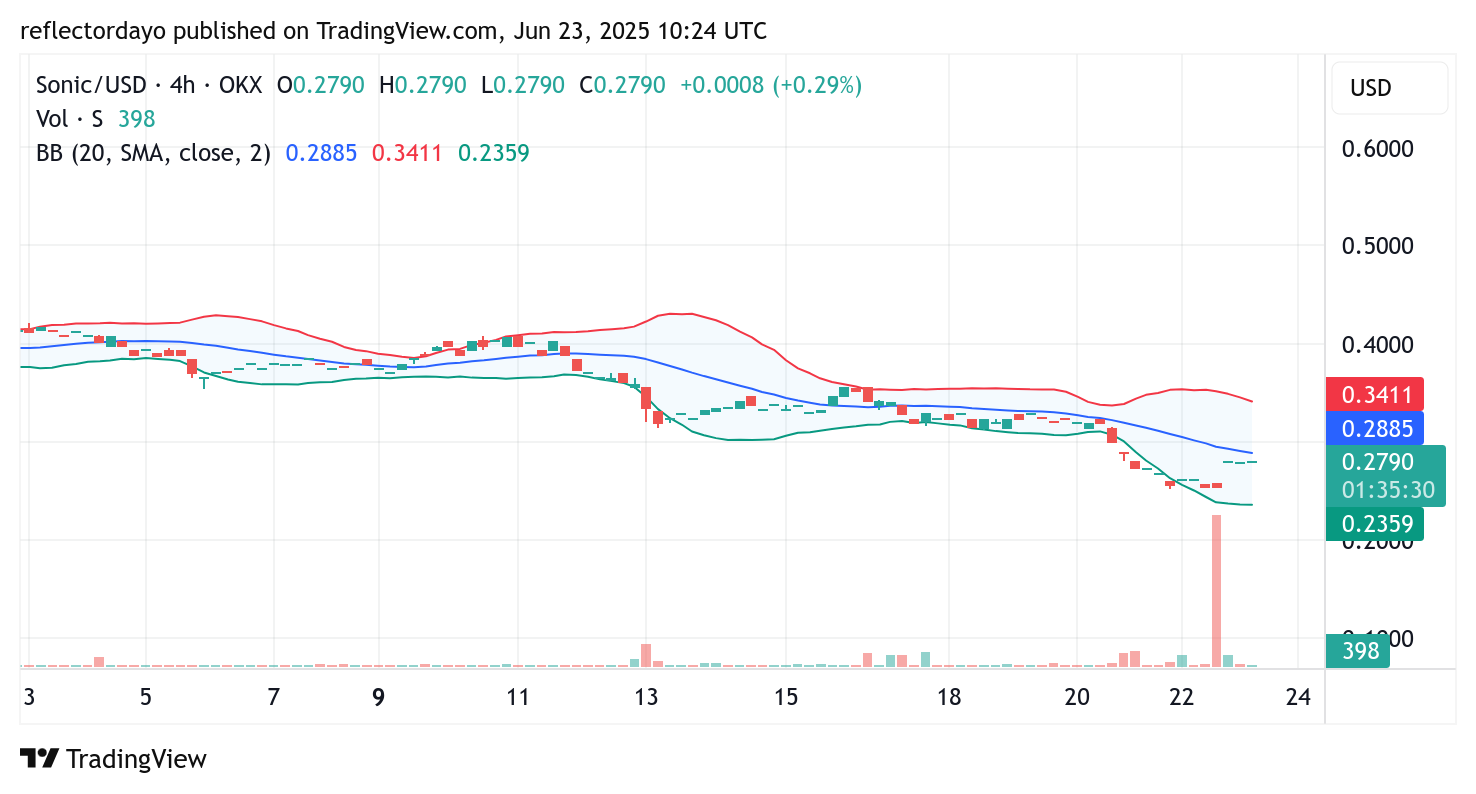
The 4-hour chart of the Sonic (SUSD) market reflects a similar sentiment to the broader daily chart outlook. Following a sharp rebound in the previous session—triggered by heightened trading activity—the price action faced resistance around the $0.28 level.
Since encountering this barrier, the market has remained static across three consecutive 4-hour trading sessions, suggesting a temporary pause in momentum. With price action now firmly pegged at $0.28, market participants are closely monitoring this level for clues on the next directional move. A breakout or rejection here could determine whether SUSD sustains a recovery or resumes its broader downtrend.