Lucky Block Price Prediction: LBLOCK/USD Range-bounds; Price Ready to Surge Upward
Estimated Reading Time: 3 minutes
Don’t invest unless you’re prepared to lose all the money you invest. This is a high-risk investment and you are unlikely to be protected if something goes wrong. Take 2 minutes to learn more

Free Crypto Signals Channel
The Lucky Block price prediction retreat below the 9-day and 21-day moving averages so that the coin shoots to the upside.
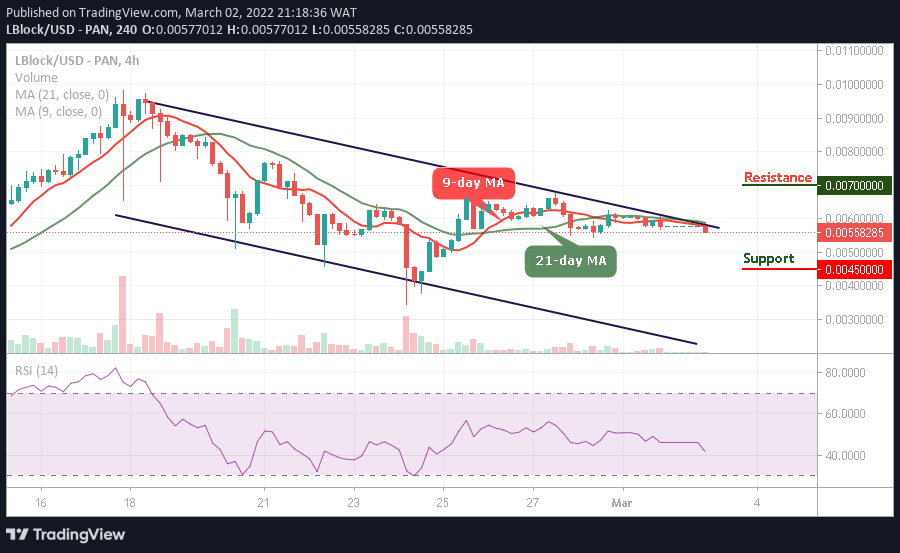
LBLOCK/USD Medium-term Trend: Ranging (4 Hour Chart)
Key Levels:
Resistance levels: $0.0070, $0.0075, $0.0080
Support levels: $0.0045, $0.0040, $0.0035
Looking at the 4-hour chart, LBLOCK/USD is ranging below the 9-day and 21-day moving averages. The lucky Block price is therefore getting ready to cross above the upper boundary of the channel as the 9-day moving average prepares to cross above the 21-day moving average. However, traders are anticipating that the current price movement is an indication of the upcoming price rally in the market.
Lucky Block Price Prediction: Where is LBLOCK/USD Going Next?
According to the 4-hour chart, the next step for the Lucky Block price is to cross above the channel; once this is done, bulls would now face the resistance levels of $0.0070, $0.0075, and $0.0080 respectively. However, as the technical indicator Relative Strength Index (14) moves to cross below 40-level, LBLOCK/USD would manage to sustain the bullish movement above the channel. Meanwhile, if the coin retreats a little bit to the south, the support levels of $0.0045, $0.0040, and $0.0035 may be visited and this would be the best opportunity for the new investors to come into the market.
LBLOCK/USD Medium-term Trend: Ranging (2 Hour Chart)
On the 2-hour chart, the Lucky Block price is in a range and it is currently trading below the 9-day and 21-day moving averages. At the moment, the buyers are gathering the momentum in other to push the coin to the north. as the technical indicator Relative Strength Index (14) moves into the oversold region.
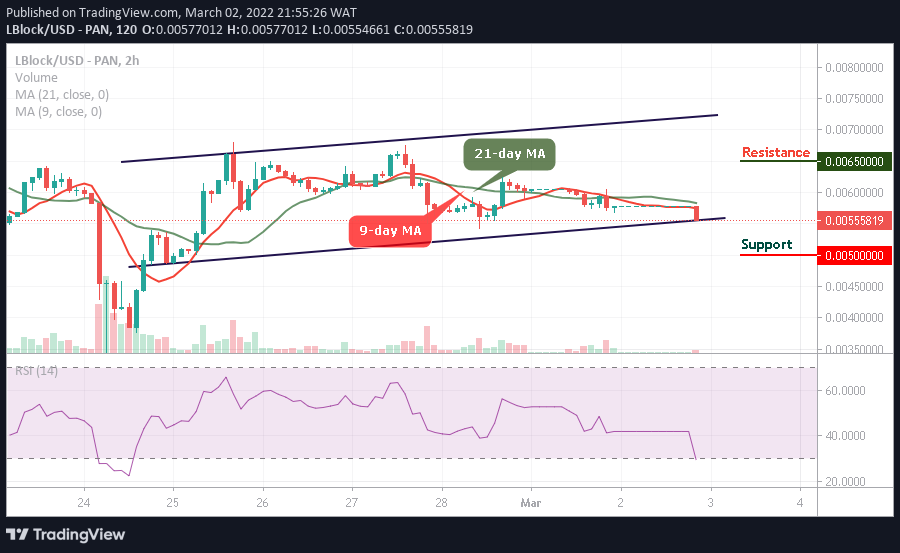
However, if the bulls succeed in pushing the price towards the upside, the Lucky Block would rise to the resistance level of $0.0065 and above but this might not come to play if the 9-day MA remains below the 21-day MA. However, if the market gains a few more negative moves and falls from the current market value, this could bring the price below the lower boundary of the channel, staying there may cause the coin to reach the support level of $0.0050 and below.
Read more: