Lucky Block Price Prediction: LBLOCK/USD Awaits a Breakout at $0.0062 Level
Estimated Reading Time: 3 minutes
Don’t invest unless you’re prepared to lose all the money you invest. This is a high-risk investment and you are unlikely to be protected if something goes wrong. Take 2 minutes to learn more

Free Crypto Signals Channel
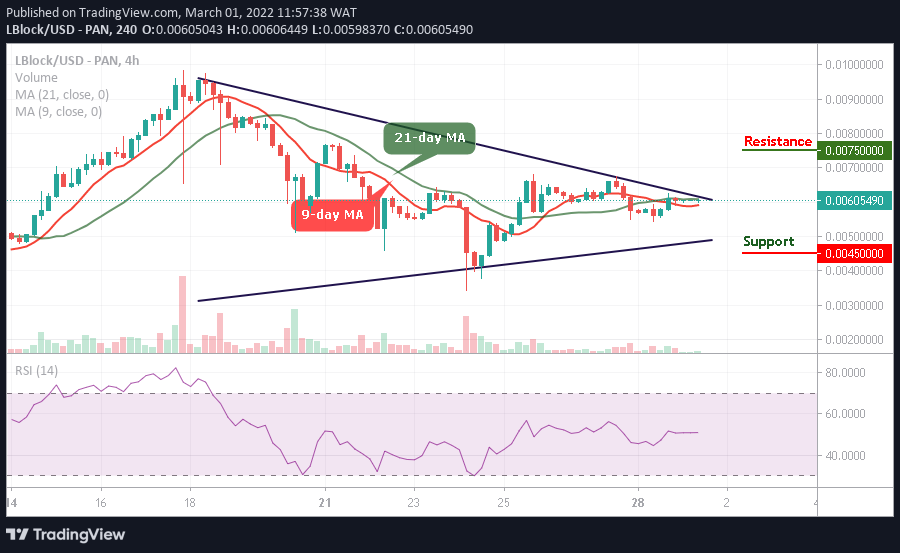
The daily chart reveals that the Lucky Block price prediction is preparing to break above the upper boundary of the channel.
LBLOCK/USD Medium-term Trend: Ranging (4 Hour Chart)
Key Levels:
Resistance levels: $0.0075, $0.0080, $0.0085
Support levels: $0.0045, $0.0040, $0.0035
LBLOCK/USD is moving sideways around $0.0060 at the time of writing. In the range of the symmetric triangle, the closest support is located at $0.0055, with a resistance close to $0.0065. However, if the market increases, additional resistance may cross above the channel, but below the symmetric triangle, traders can expect the support of around $0.0050.
Lucky Block Price Prediction: LBLOCK/USD Gets Ready for the Upside
The Lucky Block price is seen trading around the 9-day and 21-day moving averages and it is obvious that the market would rise after the sideways movement, as this could also be confirmed by the technical indicator Relative Strength Index (14). According to the 4-hour chart, LBLOCK/USD may continue to move in the same direction as the market ranges.
Nevertheless, the Lucky Block is trading around $0.0060 by not dropping below the 9-day moving average. However, if the Lucky Block retreats a little bit, the coin is likely to touch the support levels of $0.045, $0.0040, and $0.0035, but the traders should expect a bullish spike towards the resistance levels of $0.0075, $0.0080, and $0.0085 respectively.
LBLOCK/USD Medium-term Trend: Ranging (2 Hour Chart)
On the 2-hour chart, the support level of this range is built around $0.0055. The resistance could be found at $0.00455 because the market price stays within the 9-day and 21-day moving averages which could slide to the support level of $0.0050 and below. Looking at it technically, the Lucky Block price is expected to cross above the channel as the technical indicator Relative Strength Index (14) prepares to cross above 50-level.
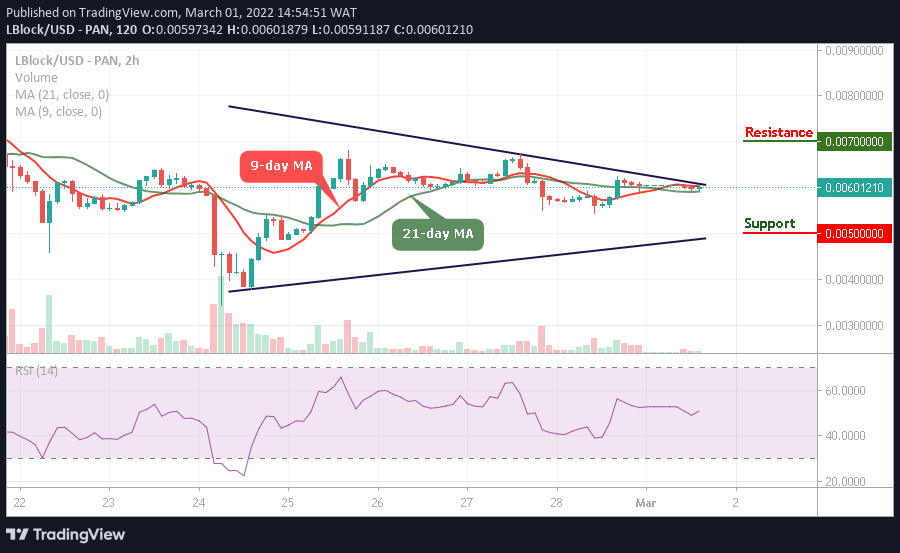
However, immediately the signal line leaves the oversold zone, LBLOCK/USD would begin an upward movement. Therefore, any bullish cross above the moving averages may hit the resistance level of $0.00460 and above.
Read more: