Lucky Block Price Prediction: LBLOCK/USD Gets Ready for a Spike Above $0.0060
Estimated Reading Time: 3 minutes
Don’t invest unless you’re prepared to lose all the money you invest. This is a high-risk investment and you are unlikely to be protected if something goes wrong. Take 2 minutes to learn more

Free Crypto Signals Channel
The daily chart reveals that if bulls increase their momentum, the Lucky Block price prediction would rise towards the previous high of $0.00240 level.
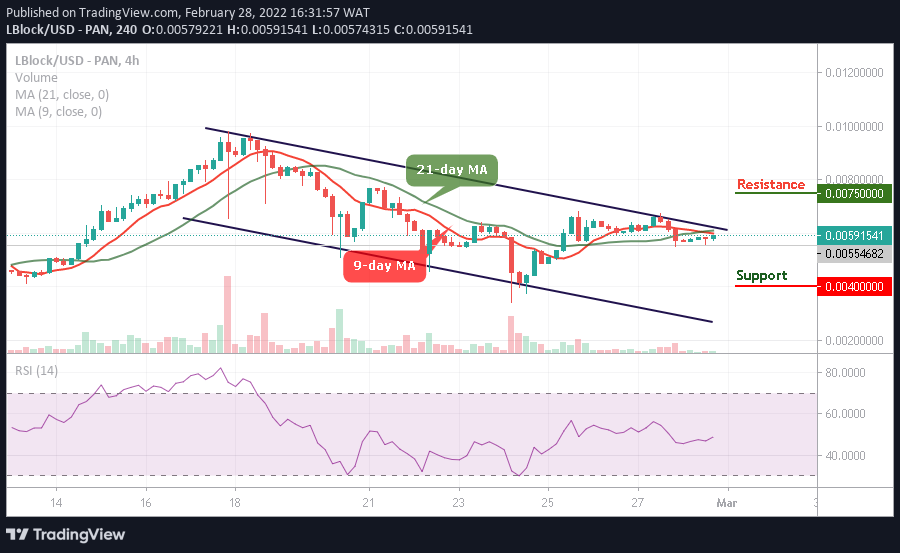
LBLOCK/USD Medium-term Trend: Ranging (4 Hour Chart)
Key Levels:
Resistance levels: $0.0075, $0.0080, $0.0085
Support levels: $0.0040, $0.0035, $0.0030
At the time of writing, LBLOCK/USD is ranging as the market price prepares to cross above the 9-day and 21-day moving averages. Meanwhile, the bullish momentum would push the coin above the resistance level of $0.0060. However, should the bulls fail to push the price upward, the Lucky block price may consolidate within the channel.
Lucky Block Price Prediction: What to Expect from LBLOCK/USD
The Lucky Block price is changing hands at $0.0059 where it prepares to cross above the upper boundary of the channel. However, if the coin continues the upward movement, the coin may locate the potential resistance levels at $0.0075, $0.0080, and $0.0085 while the support levels could be located at $0.0040, $0.0035, and $0.0030 as the technical indicator Relative Strength Index (14) is likely to move above 50-level.
LBLOCK/USD Medium-term Trend: Ranging (2 Hour Chart)
On the 2-hour chart, the Lucky Block price crosses above the 9-day and 21-day moving averages with a bullish candle. However, the technical indicator Relative Strength Index (14) is likely to cross above 60-level to keep the coin at the upside. Meanwhile, any further bullish movement towards the upper boundary of the channel could hit the resistance level at $0.0070 and above.
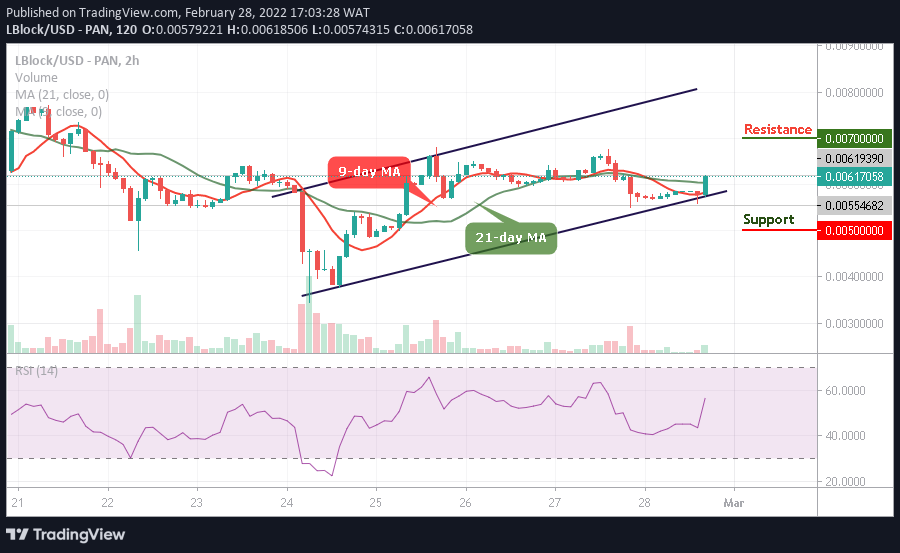
On the contrary, LBLOCK/USD needs to experience more bullish signals and once this happens, the market price may keep moving above the moving averages, but if the price drop below the market value at $0.0061, it could touch the critical support at $0.0050 and below. The technical indicator Relative Strength Index (14) reveals that the market is ready to spike as the signal line gets ready to cross above 60-level.
Read more: