Binance Coin Continues Bullish Run, Breaks Above $650 High
Estimated Reading Time: 2 minutes
Don’t invest unless you’re prepared to lose all the money you invest. This is a high-risk investment and you are unlikely to be protected if something goes wrong. Take 2 minutes to learn more
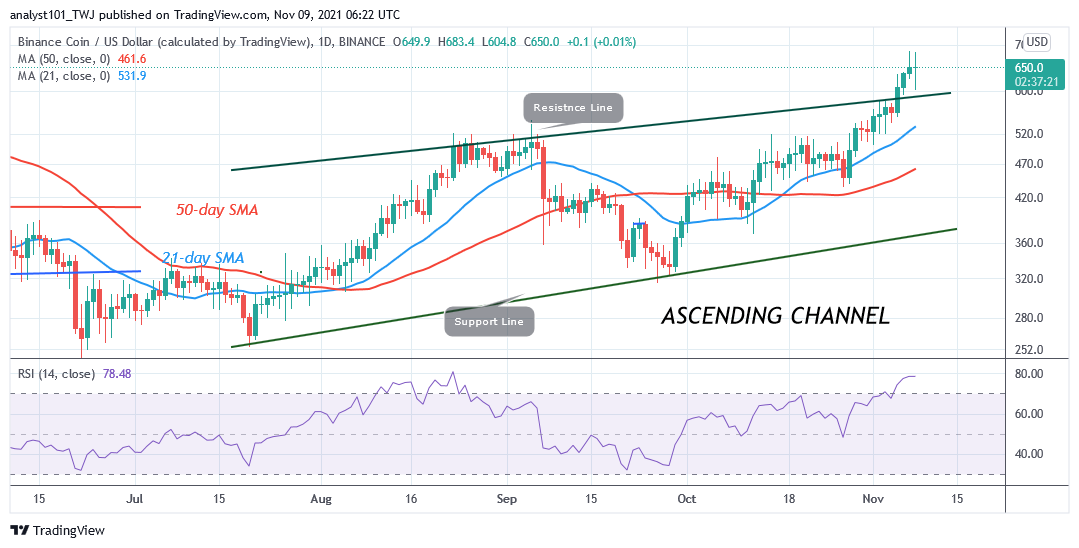

Binance Coin (BNB) Long-Term Analysis: Bullish
Binance Coin (BNB) has resumed its upward move after breaking above the resistance at $520. The altcoin has traded and reached the high of $650. Further upward move is doubtful as the market reaches level 78 of the Relative Strength Index.BNB/USD will rally above $700, if the bulls clear the $670 resistance.
Binance Coin (BNB) Indicator Analysis
BNB is at level 78 of the Relative Strength Index period 14. It indicates that the cryptocurrency is in the overbought region. Sellers are likely to emerge in the overbought region to push prices down. BNB is above the 80% range of the daily stochastic. It indicates that it is in a bullish momentum and has reached the overbought region. The crypto’s price has broken above the resistance line of the ascending channel. It indicates that the uptrend has commenced.
Technical indicators:
Major Resistance Levels – $640, $660, $680
Major Support Levels – $540, $520, $500
What Is the Next Direction for Binance Coin (BNB)?
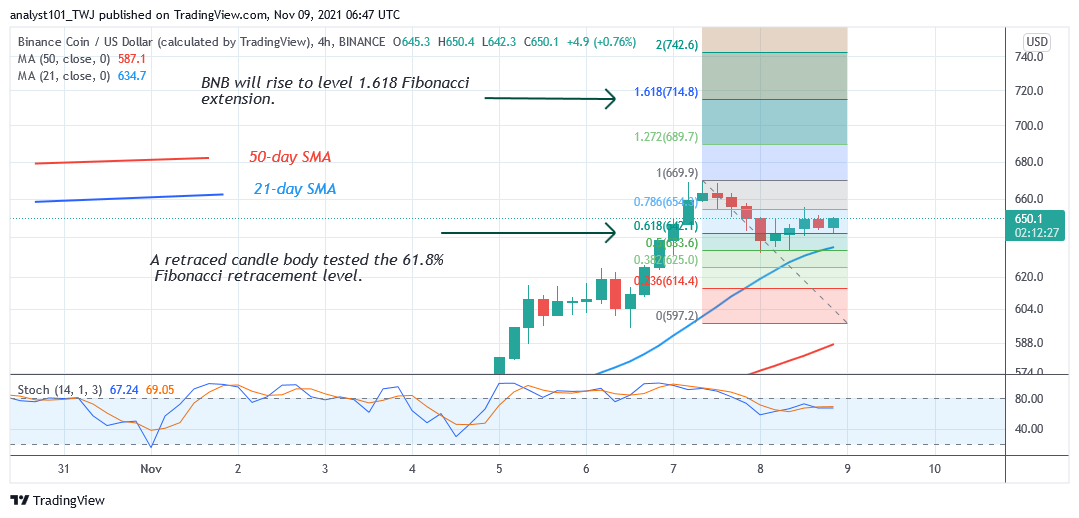
On the 4 –hour chart, BNB/USD is in an upward move. The altcoin’s price has broken above the moving averages. Meanwhile, on November 7 uptrend; a retraced candle body tested the 61.8% Fibonacci retracement level. The retracement indicates that Binance Coin will rise to level 1.618 Fibonacci extension or $714.80.
You can purchase crypto coins here. Buy Tokens
Note: Cryptosignals.org is not a financial advisor. Do your research before investing your funds in any financial asset or presented product or event. We are not responsible for your investing results