Solana (SOL) Price Prediction: SOL/USDT Remains Subdued Below the $180.00 Threshold
Estimated Reading Time: 3 minutes
Don’t invest unless you’re prepared to lose all the money you invest. This is a high-risk investment and you are unlikely to be protected if something goes wrong. Take 2 minutes to learn more

Solana (SOL) Price Prediction: June 7
Trading activity in the Solana market has remained below the $180.00 threshold since last week. The market trend so far hasn’t been very exciting, except for the fact that price action remains above technical landmarks. However, this has been the case since the commencement of price consolidation last week.
SOL/USDT Long-term Trend: Bullish (Daily Chart)
Key Price Levels:
Resistance Levels: $180.00, $190.00, and $200.00
Support Levels: $160.00, $150.00, and $140.00
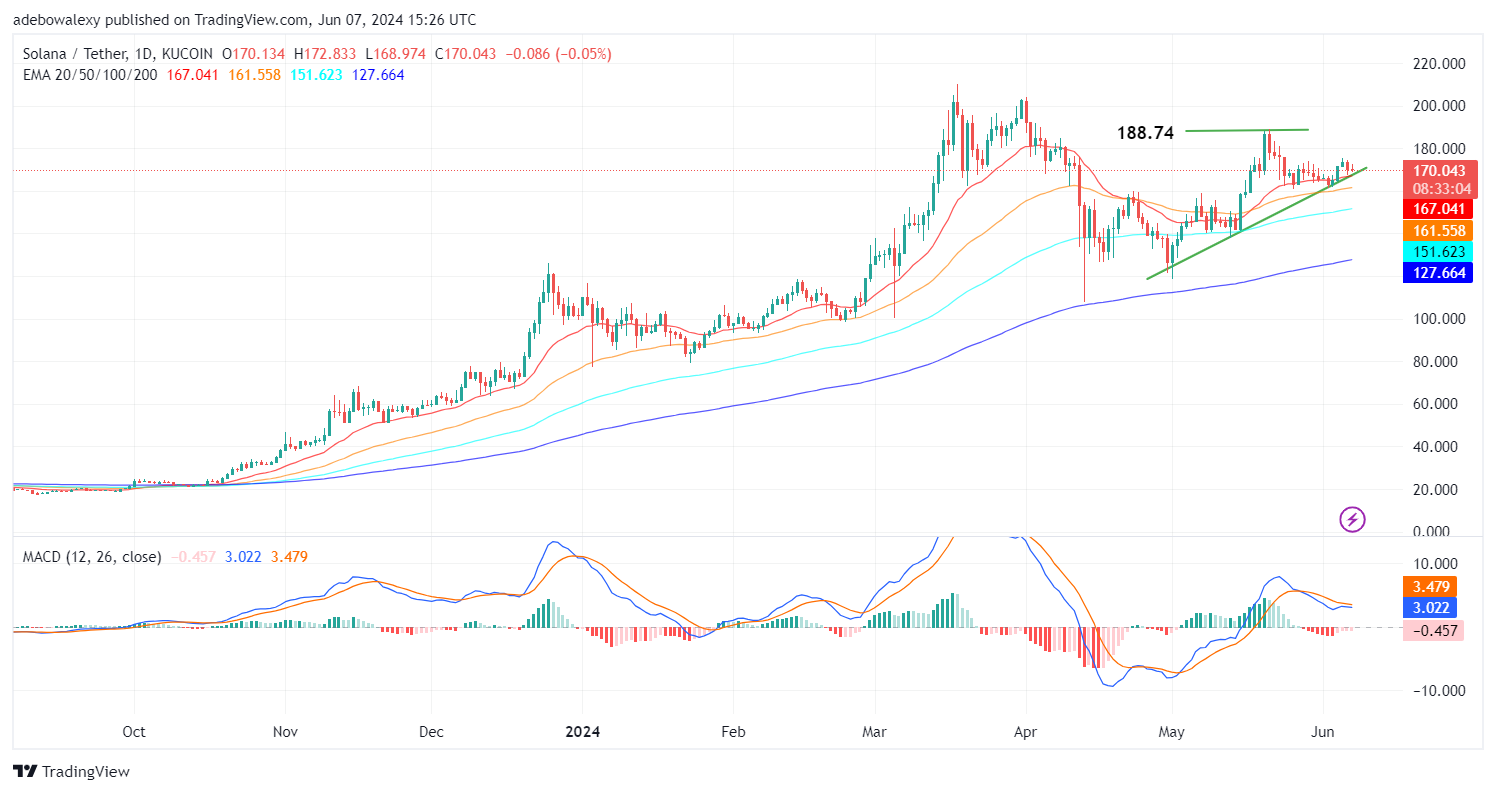
Price movement in the Solana daily market has been consolidating below the $180.00 price level since last week. As a result, price action has been above the Exponential Moving Average (EMA) lines. Nevertheless, this hasn’t provided a significant push for price action. There was a more noticeable price decline in the previous session than in the ongoing session. Despite this, the market keeps making higher highs as of the time of writing. The lines of the Moving Average Convergence Divergence (MACD) are above the equilibrium level and seem to have moved closer to each other, while its bars are now pale red below the equilibrium level.
Solana Price Prediction: Will Headwinds Grow Stronger in the SOL/USDT Market?
From the perspective of trading indicators, it appears that the Solana market may likely continue the consolidation. This is because price action continues to stay away from the $180.00 mark. More interestingly, price action seems to lack the needed impetus at the moment.
Furthermore, while downward forces stay in control in this market, we can see that upside forces are causing a contraction in the ongoing session. This suggests that market forces may keep the market in a consolidation move. The lines of the MACD drew closer previously but continued sideways afterward. This effectively reveals that the market lacks the propensity to break the $180.00 price line.
SOL/USDT Medium-term Trend: Solana May Test the Upside-Sloping Trendline (4H Chart)
The SOL/USDT 4-hour market reveals that headwinds are getting stronger and may drive the price lower. Already, the market has broken the support at the $170.00 mark. The last price candle on this chart can be seen plunging below the 20-day EMA line. Also, the 50-day EMA line is currently being tested as a support level. The MACD indicator lines are above the equilibrium level.
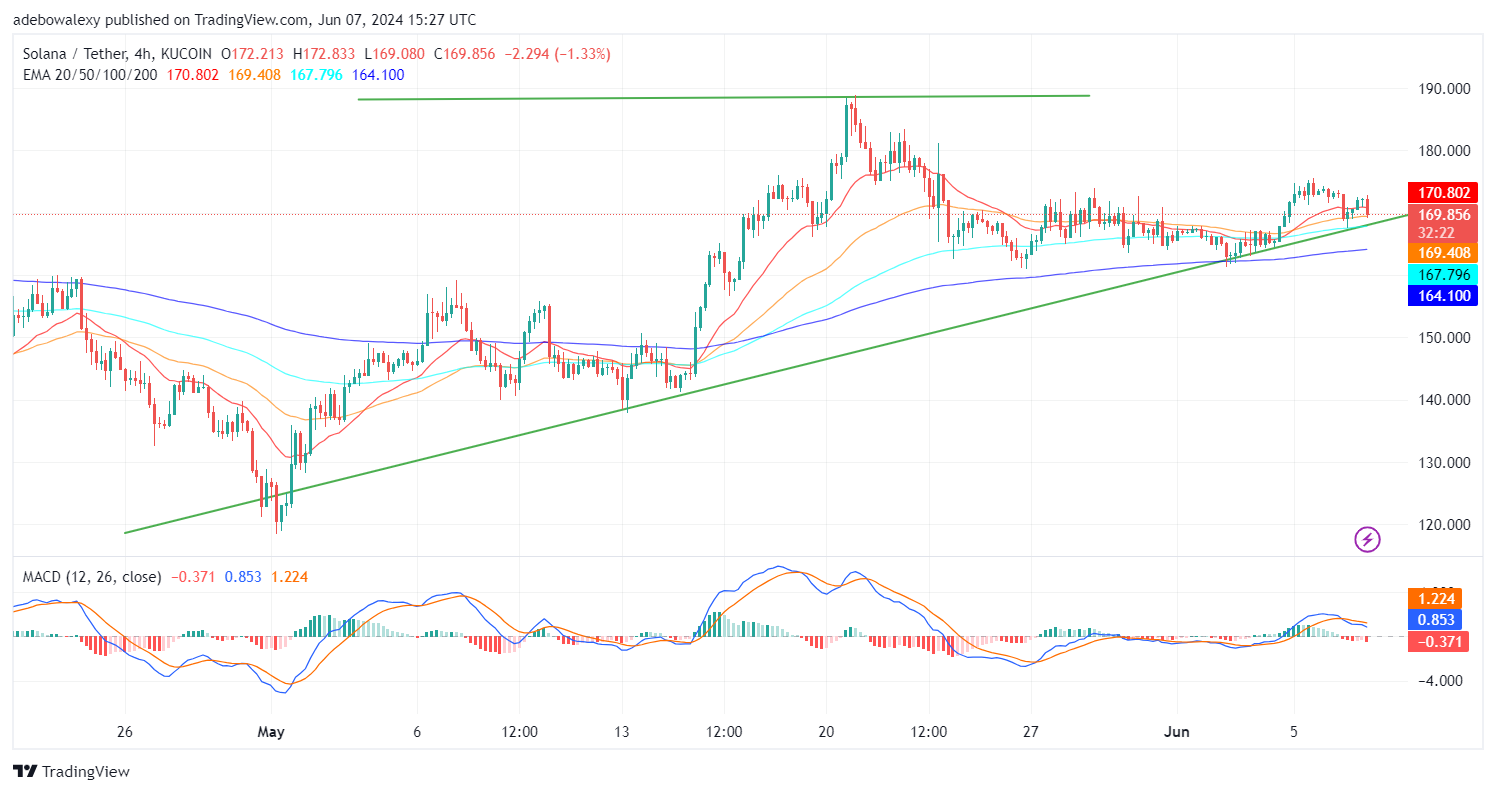
It should be noted that the last bar on the indicator is now solid red. Likewise, the leading line of the indicator seems tilted towards the equilibrium level from above. At this point, headwinds seem to threaten any upside hopes. Therefore, market participants may prepare to witness a correction off the upside-sloping trend line to see if the market may refocus on the $180.00 level from there.