Bitcoin (BTC) Price Prediction: BTC/USDT Continues Trading Above the $70,000 Threshold
Estimated Reading Time: 3 minutes
Don’t invest unless you’re prepared to lose all the money you invest. This is a high-risk investment and you are unlikely to be protected if something goes wrong. Take 2 minutes to learn more

Bitcoin (BTC) Price Prediction: June 5
Price action in the Bitcoin daily market broke the resistance at the $70,000 price level yesterday. Since then, price action has stayed above that mark and continues to trade above it, even without finding support at that level.
BTC/USDT Long-term Trend: Bullish (Daily Chart)
Key Levels:
Resistance Levels: $75,000, $80,000, and $85,000
Support Levels: $70,000, $65,000, and $60,000
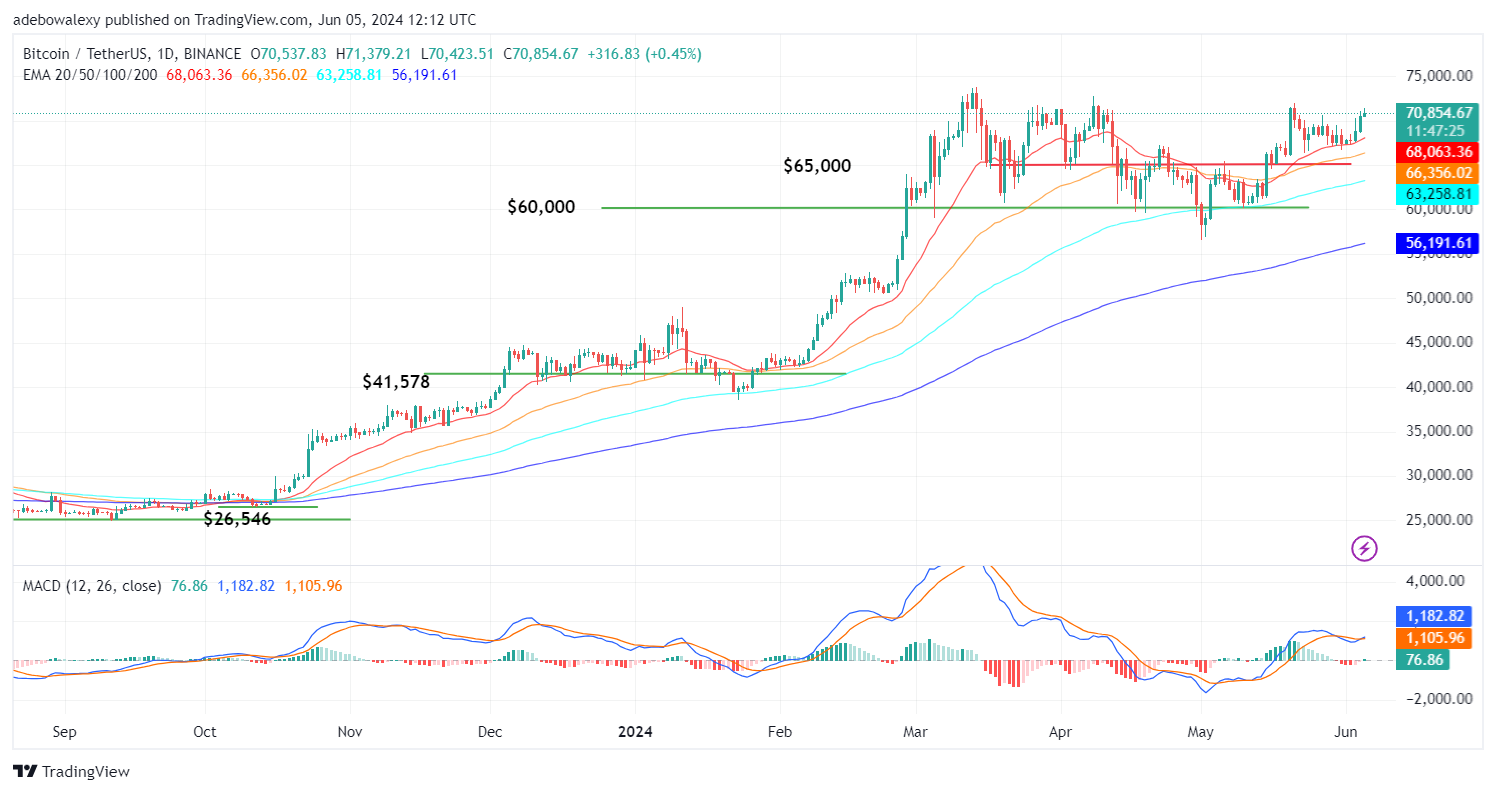
As earlier noted, trading activity for the day has continued above the $70,000 mark. The mentioned price level lies above the Exponential Moving Average (EMA) lines. However, a sign of rejection can be seen on the last price candle on this chart. Furthermore, we can see that the Moving Average Convergence Divergence (MACD) bars have performed a bullish crossover above the equilibrium level.
Bitcoin Price Prediction: Where Is BTC/USDT Headed?
Price action in the Bitcoin market has breached the $70k mark during yesterday’s trading session. This significantly advanced the market further above the 20-day EMA curve. The last price candle maintains the previously acquired bullish stance, despite the considerable reduction of upside momentum, as indicated by the size of the last price candle on this chart.
Meanwhile, the MACD indicator lines have risen past the equilibrium level of the MACD indicator. Additionally, the mentioned lines have delivered a bullish crossover there, with the ensuing lines now heading upwards. Consequently, this suggests that upside forces are still in a good position to propel the market further upward.
BTC/USDT Medium-term Trend: Downward Rejection Seems Minimal (4H Chart)
The Bitcoin 4-hour chart has revealed developments in the market. During today’s trading activities, it could be seen that there have been minimal downward corrections. Nevertheless, price activity remains above all the EMA lines. Likewise, the MACD indicator lines can be seen projected slightly upwards above the equilibrium level, despite the downward corrections seen in this market over the past two sessions.
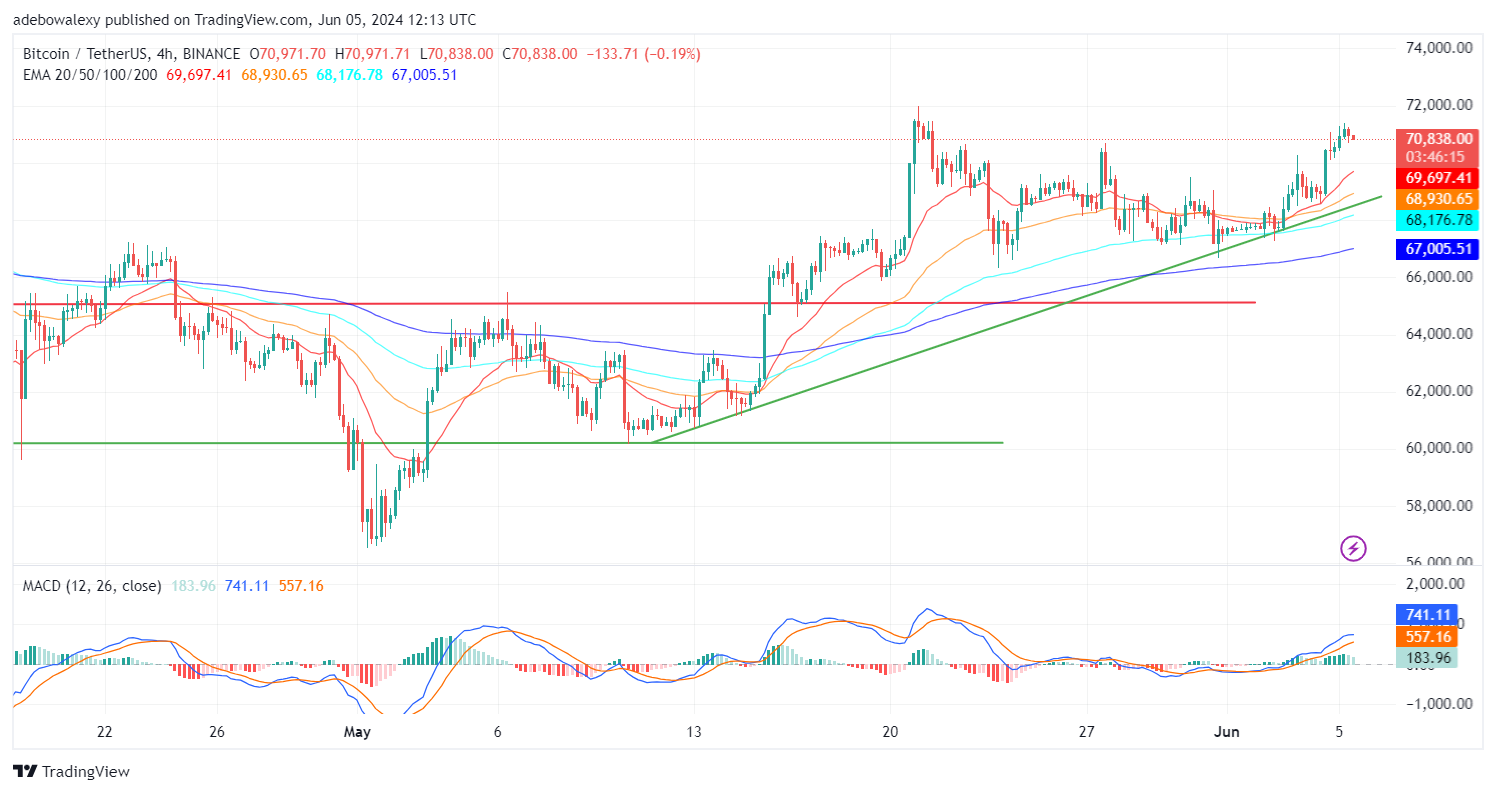
However, it should be noted that the MACD indicator in this market has registered the effect of downward forces. This is revealed through the pale green appearance of the indicator bars above the equilibrium level. Nevertheless, it appears that this market may continue its upside trajectory towards the $72,000 mark in subsequent sessions.