Litecoin (LTC) Price Prediction: The LTC/USDT Market Presents a Dicey Situation
Estimated Reading Time: 3 minutes
Don’t invest unless you’re prepared to lose all the money you invest. This is a high-risk investment and you are unlikely to be protected if something goes wrong. Take 2 minutes to learn more
Litecoin (LTC) Price Prediction: June 4
The Litecoin daily market has retreated below the technical support at the $85.00 price level. This resulted after upside forces lost the fight near the $90.00 level. Price action retraced to lower support levels over subsequent sessions till now.
LTC/USDT Long-term Trend: Bearish (Daily Chart)
Key Levels:
Resistance Levels: $85.00, $90.00, and $95.00
Support Levels: $80.00, $75.00, and $70.00
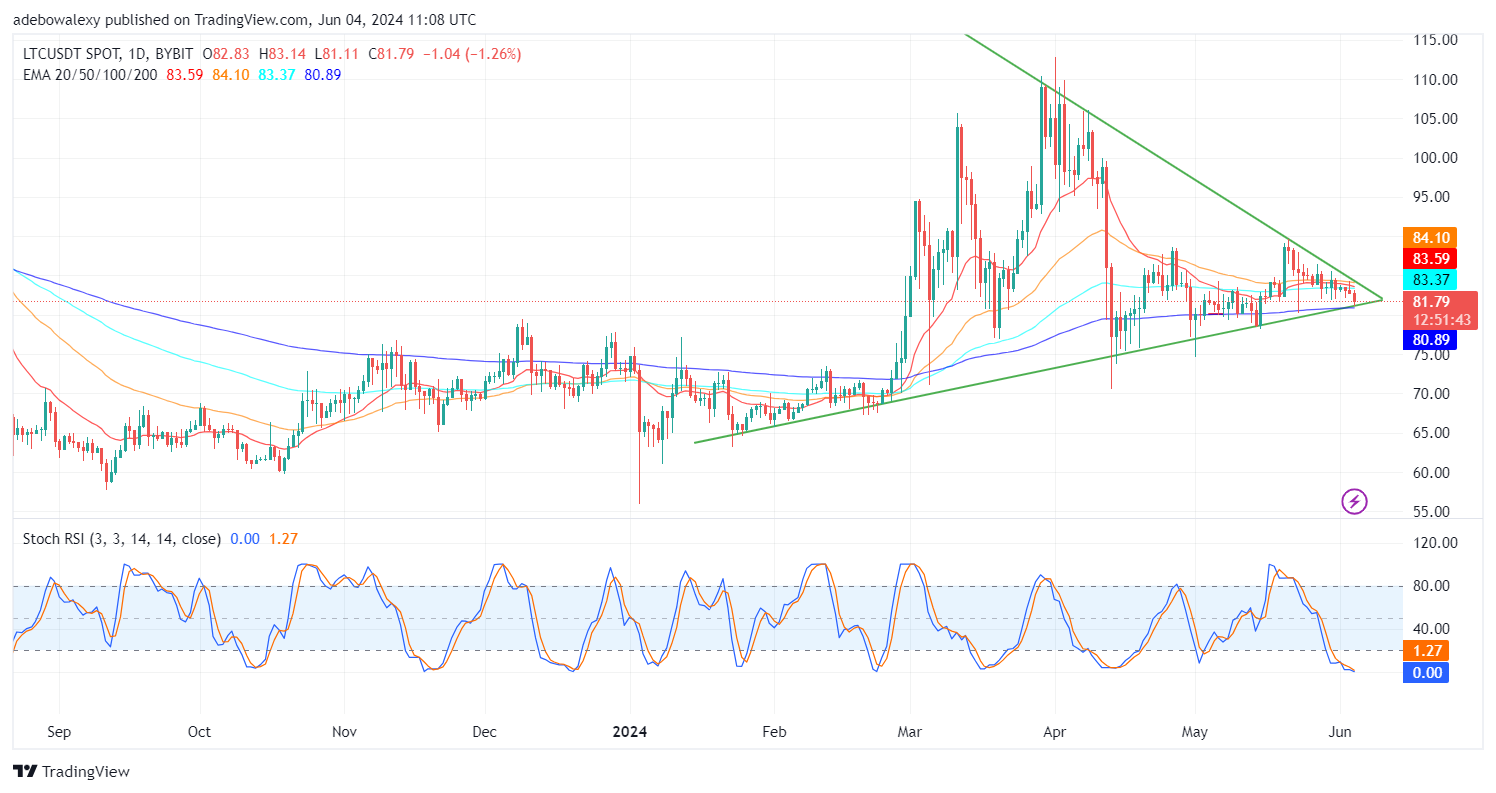
On the daily Litecoin market, price activity has fallen below most of the Exponential Moving Average (EMA) lines. At this point, the last price candle here only stands above the 200-day EMA line. The Stochastic Relative Strength Index (SRSI) lines can be seen maintaining a bearish trajectory, having reached the oversold region. Meanwhile, the pattern of price movement in the market seems more like a symmetrical triangle.
Litecoin Price Prediction: Where Will the LTC/USDT Market Breakout?
As earlier noted, price action in the Litecoin daily market can be seen below the majority of the EMA lines. The only exception is the 200-day EMA, above which stands the last price candle on this chart. However, indications from the SRSI suggest that headwinds are still viable and may cause further price declines.
The lines of the SRSI can be seen keeping a downward path even after reaching the limit of the oversold region. However, the pattern of price movement seems to be the only thing presenting bullish traders with some hope. The triangular pattern of the market suggests that the market may break out either way: upward or downward.
LTC/USDT Medium-term Trend: Litecoin Stays Under Bearish Pressure (4H Chart)
Price activity in the LTC/USDT market has fallen below all the EMA lines. Also, the appearance of recent price candles reveals that the market appears to have succumbed to headwinds. Nevertheless, the appearance of the last price candle raises some suspicion as it has a longer lower shadow. Meanwhile, the SRSI lines can be seen still hugging the oversold region, with only a slight deflection on the leading line of this indicator.
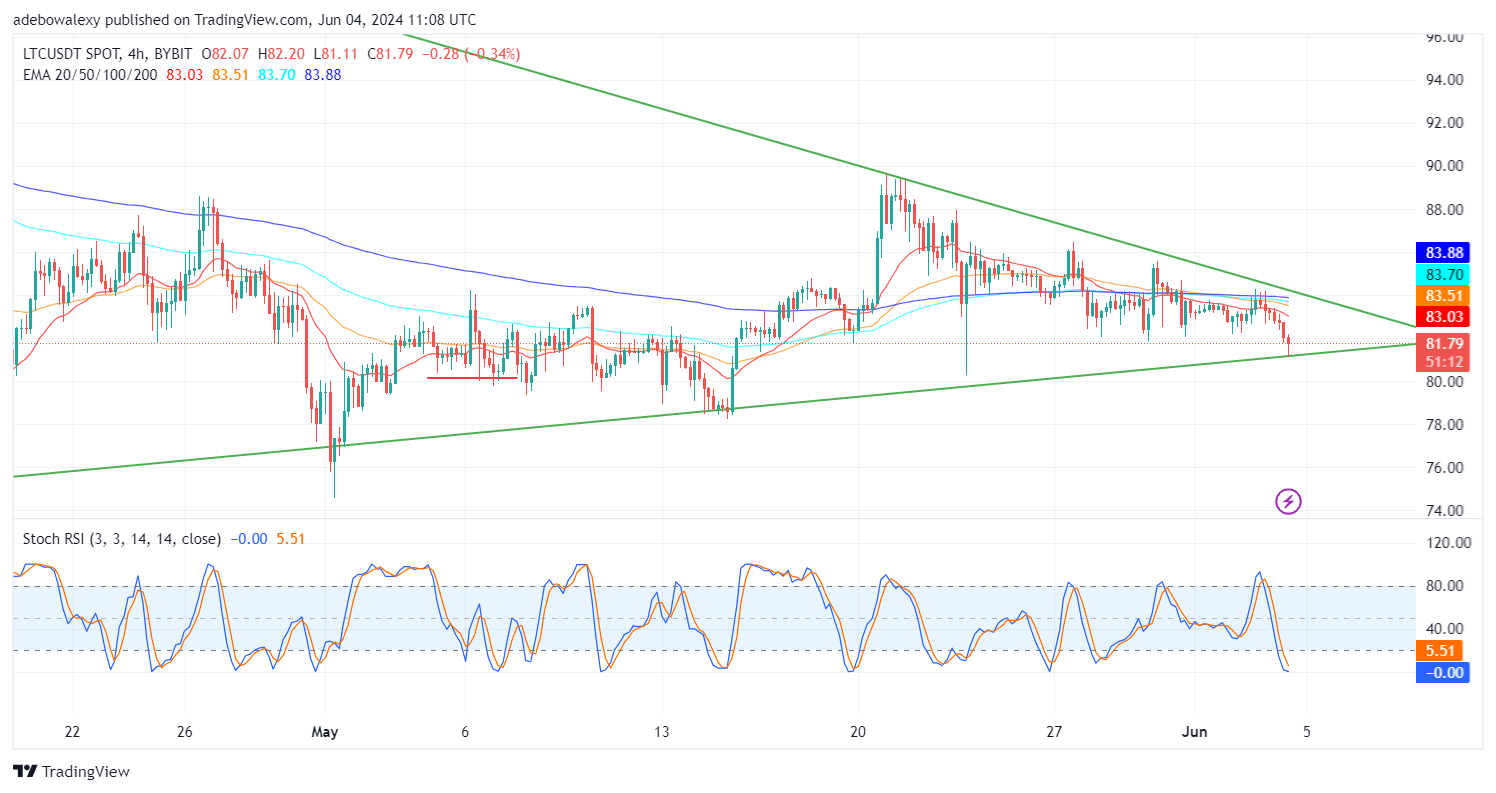
Going by technical indicators, we can see that the market is in a downtrend. This opinion stems from the fact that price action has fallen below the EMA lines and the SRSI lines have reached the oversold region. However, the appearance of the last price candle here suggests that upside forces are lurking nearby. Also, the market pattern suggests that a breakout may happen soon. So, if the bearish pressure persists, market participants may want to anticipate a rebound off the floor of the symmetrical triangle, which may have already started. This may see the market reach the $85.00 mark. But if the mentioned support fails, then $80.00 may present a much stronger baseline.