Cardano at a Crossroad: Consolidation or Reversal?
Estimated Reading Time: 3 minutes
Don’t invest unless you’re prepared to lose all the money you invest. This is a high-risk investment and you are unlikely to be protected if something goes wrong. Take 2 minutes to learn more
Cardano Long-term Analysis: Ranging
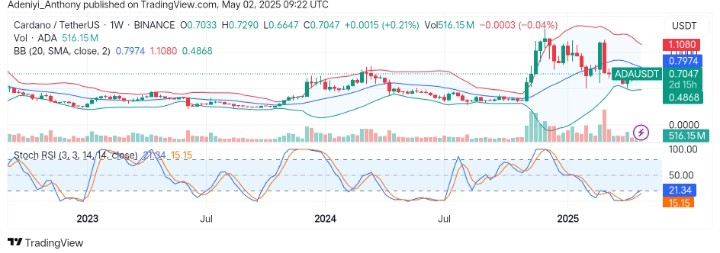
The market for Cardano against the Tether is navigating a critical juncture. However, after a strong bullish run in late 2024, the pair’s price suggests the pair is currently in a consolidation phase, reflecting a market indecision and as pair’s price oscillate close to $0.7974.
Recently, the candlesticks formation show tight ranges with long wicks, indicating a closely matched buying and selling pressure. To this end, the current uptick in price, the tightening of the Bollinger bands, and the behavior of the Stochastic RSI hint at a potential upside breakout ahead.
Currently, Cardano trades at $0.7047, recording over 516 million traded volumes for the week.
Technical Indicators
Major Resistance Levels: $0.7974, $0.9500, and $1.1080
Major Support Levels: $0.7047, $0.6000, and $0.4868
Cardano Technical Analysis
The analysis of Cardano against Tether on the weekly chart shows the pair is moving with a tight space with the potential of breaking out given the Bollinger squeeze. However, the price seems to be approaching the mid-dynamic level at $0.7974, suggesting a strong resistance ahead.
On the other hand, the oversold condition of the Stochastic oscillator suggests an impending short-term buying activity is on the horizon as the price approaches a major hurdle.
To this end, a break above $0.7974 in the near term would decide if it will be a continued consolidation move or an upside move.
ADA/USDT Analysis: What’s Next?
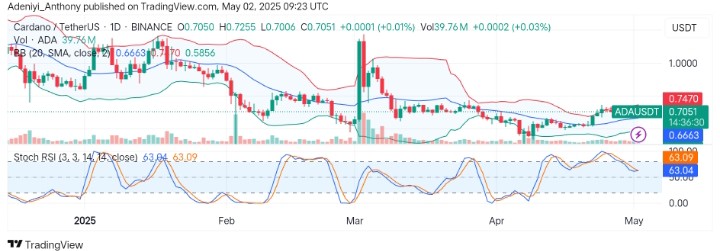
On the daily chart, ADA/USDT appears to be hovering around the upper limit of the Bollinger bands as the volatility increases. In contrast, the oscillator beneath the chart suggests a mild bullish momentum aligning with the weekly trend.
However, more challenges are on the way as the upper band lies at $0.7470, and the volume indicates a lack of bullish conviction with dynamic support at $0.6663.
To this end, a break above $0.7470 in the near term could trigger a move toward $1.1080; otherwise, the pair may continue its range-bound movement.
You can purchase crypto coins here. Buy LBlock