Cardano (ADA/USDT) Faces Decision Point: Relief Rally or Deeper Consolidation
Estimated Reading Time: 3 minutes
Don’t invest unless you’re prepared to lose all the money you invest. This is a high-risk investment and you are unlikely to be protected if something goes wrong. Take 2 minutes to learn more
Cardano Long-term Analysis: Ranging
Cardano against the Tether has been under pressure in the past weeks after a promising rally in the previous year, slipping below the Guppy Multiple Moving Averages (GMMAs) as the momentum fades.
In recent times, the pair has dropped by 3.48% beyond critical levels. The Stochastic RSI hints at a possible relief bounce due to the oversold condition. However, the declining volume and the tightening cluster of exponential moving averages suggest the price might continue a range-bound movement till a decisive breakout is noticed.
Currently, Cardano trades at $0.6161, recording over 470 million traded volumes already.
Technical Indicators
Major Resistance Levels: $0.6611, $0.704, and $1.000
Major Support Levels: $0.6000, $0.5500, and $0.4800
Cardano Technical Analysis
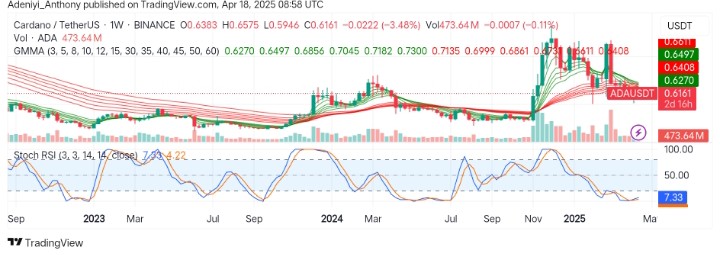
On the weekly timeframe, Cardano against the Tether appears to be consolidating under the GMMAs, signaling a pause or a weakening bullish momentum due to weakened buying volume.
However, the Stochastic oscillator beneath the chart shows the pair is currently oversold, as the blue line reads a value of 7.33, suggesting a short-term bounce could be near, provided the price can hold above $0.6000 while anticipation for a bullish crossover increases.
To this end, if the pair fails to reclaim the $0.6400 convincingly, the market may remain range-bound or become bearish.
ADA/USDT Analysis: What’s Next?
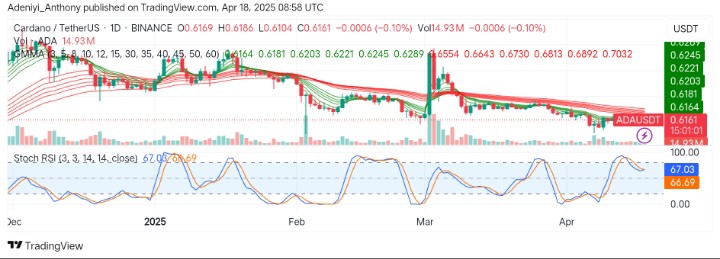
On the daily chart, ADA/USDT appears to be bearish as the price trades below the cluster of EMAs. However, the Stochastic RSI seems to be cooling off, suggesting a potential short-term weakness as the volume traded remains low and declining after a brief spike in the previous month.
However, despite a minor push in recent times, sellers’ dominance is recorded in the market as the price holds 0.10% below the daily opening price.
To this end, the daily structure confirms a bearish trend, but as the blue line of the Stochastic RSI prepares to move upside, the bulls must defend the current level to avoid deeper retracement below the $0.6000 level.
You can purchase crypto coins here. Buy LBlock