Cartesi (CTSI/USD) Attempts a Break Above Key Resistance
Estimated Reading Time: 3 minutes
Don’t invest unless you’re prepared to lose all the money you invest. This is a high-risk investment and you are unlikely to be protected if something goes wrong. Take 2 minutes to learn more

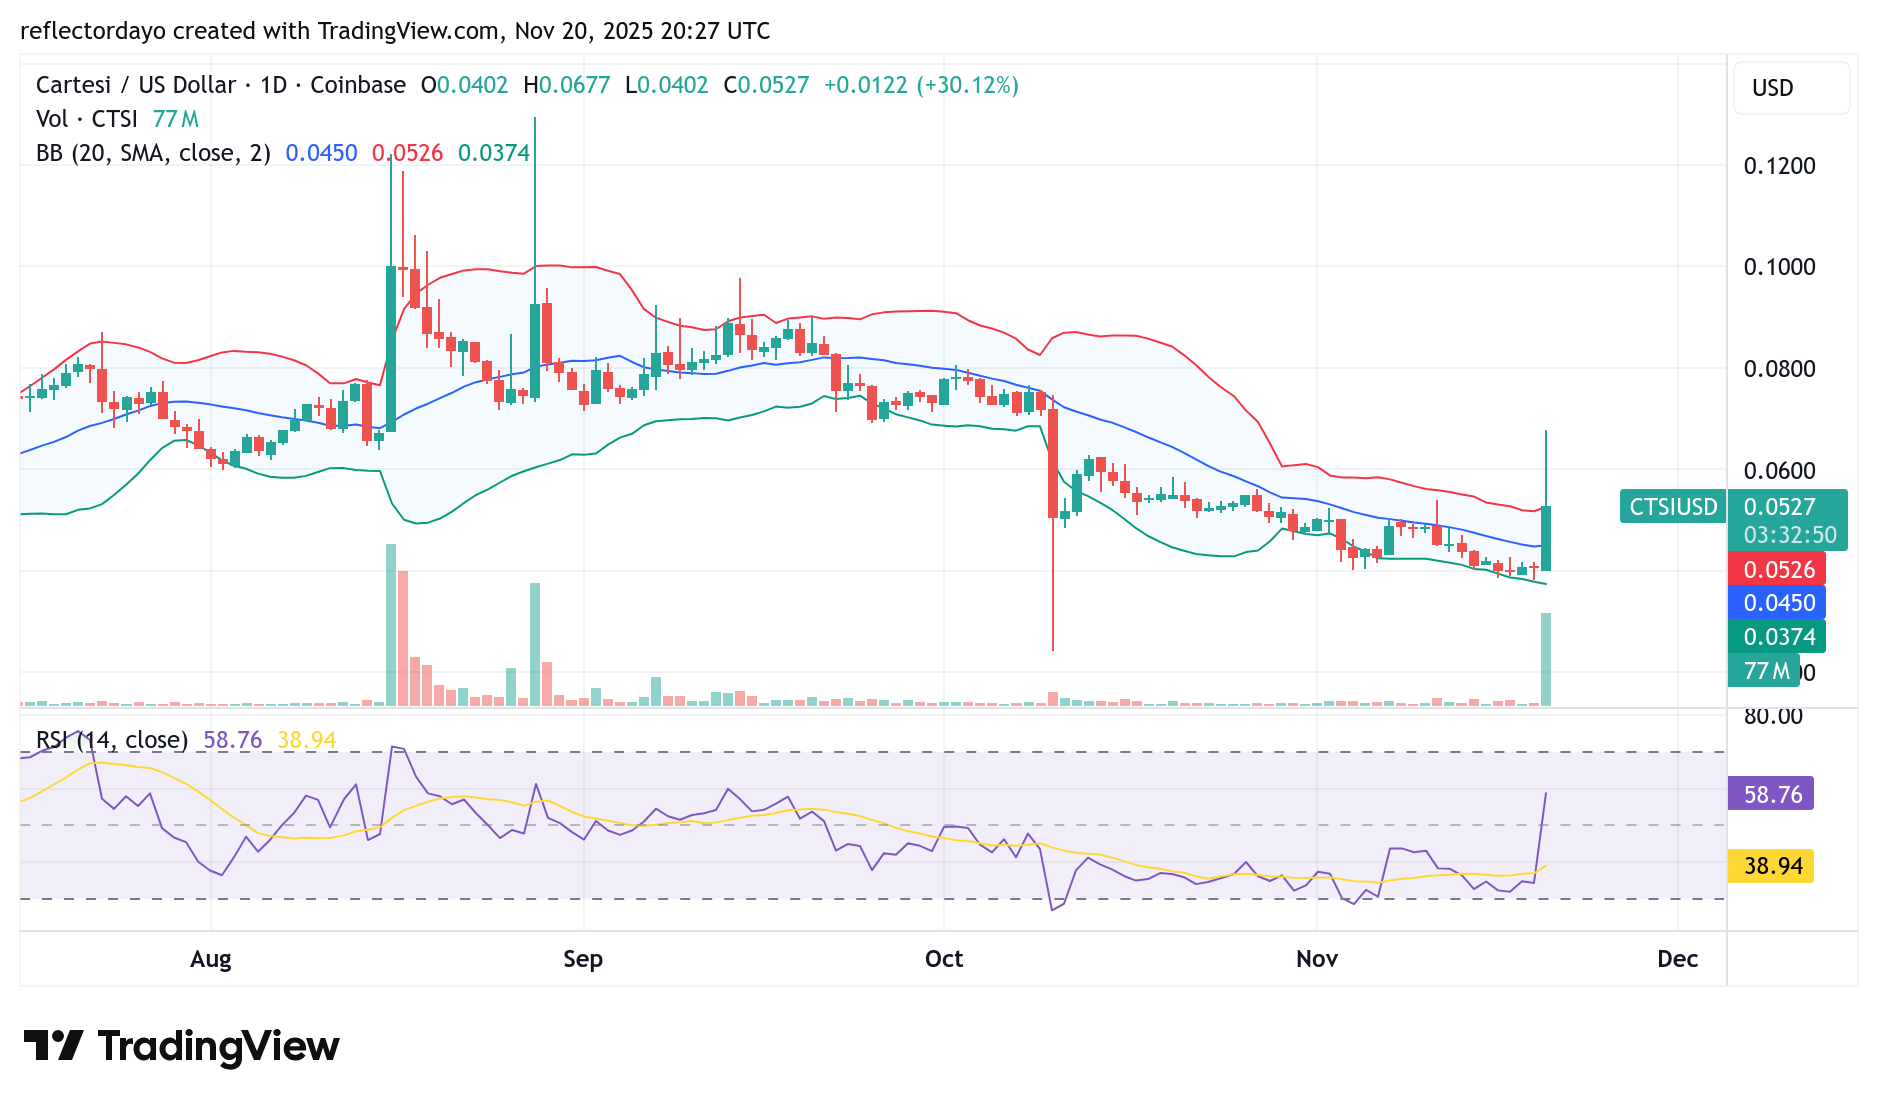
During today’s trading session, Cartesi has experienced a notable surge in bullish momentum, pushing prices upward. The rally began around the $0.0530 level, with buyers attempting to sustain a move above the $0.060 resistance zone. However, the market was unable to hold above this critical level, causing the price to slip back below the barrier, where it is currently stabilizing.
The bullish impulse was strong enough to spark expectations of a significant correction. This explains why, after reaching an intraday high near $0.068, the market retraced and settled around the $0.0535 region—an area that now serves as a key resistance-turned-retest zone.
Overall, the market structure signals strong bullish intent, but a confirmed breakout above $0.060 will be needed to validate the next upward leg.
Cartesi (CTSI/USD) Market Data
- CTSI/USD Price Now: $0.053
- CTSI/USD Market Capitalization: $45.8 million
- CTSI/USD Circulating Supply: 887.8 million CTSI
- CTSI/USD Total Supply: 1 billion CTSI
- CTSI/USD CoinMarketCap Ranking: #467
Key Levels to Watch
- Resistance: $0.060, $0.065, $0.070
- Support: $0.045, $0.040, $0.035
Cartesi (CTSI/USD) Daily Chart Analysis
Cartesi posted a strong bullish surge in the latest trading session, signaling the potential for a broader trend reversal in favor of the bulls. However, the subsequent correction pushed the market back below the nearest resistance level—slightly dipping beneath it—which raises the possibility of price returning to its previous trading range.
At the moment, CTSI is struggling to hold above this critical zone. The next few trading sessions will be crucial, as they may determine whether the market regains upward momentum, breaks downward, or enters a consolidation phase around the $0.053 level.
A key point to note is the significant trading volume accompanying today’s bullish move. The large histogram bar indicates heightened trader participation and increasing market enthusiasm, which may suggest that buyers are strong enough to attempt another push higher.
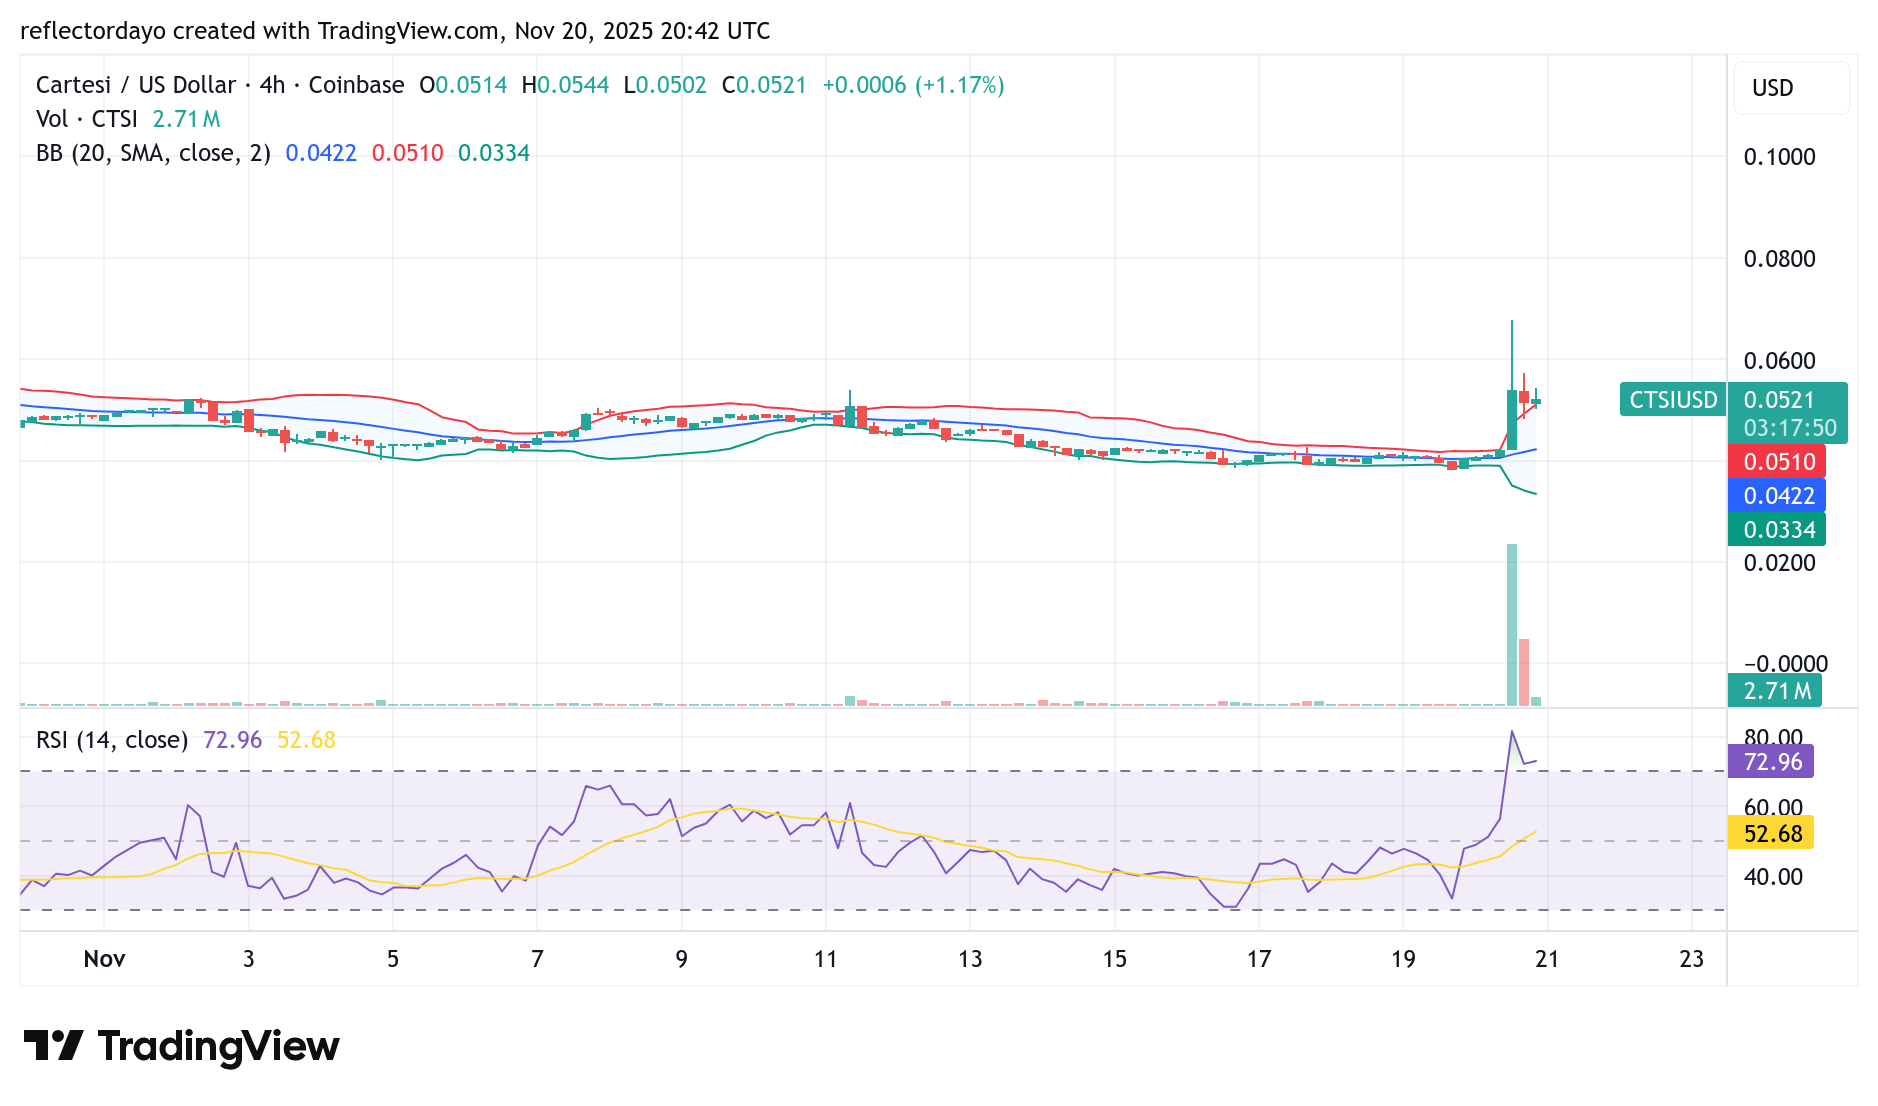
CTSI/USD 4-Hour Chart Outlook
Zooming into the 4-hour timeframe, the market appears to be setting up for potential consolidation around the $0.053 level. After pulling back from the recent peak at $0.0681, the bearish momentum weakened significantly as the price approached the previous resistance zone—now acting as a key support area.
This loss of momentum is reflected in the candle structure and the clear decline in histogram bars, signaling reduced selling pressure. However, the Relative Strength Index (RSI) remains in the oversold region, suggesting that corrective movement may still continue in the short term.
Despite this, the current structure hints that the market may soon stabilize, with consolidation likely before any decisive move in either direction.