BNB (BNB/USDT) Consolidates Near a Critical Level
Estimated Reading Time: 3 minutes
Don’t invest unless you’re prepared to lose all the money you invest. This is a high-risk investment and you are unlikely to be protected if something goes wrong. Take 2 minutes to learn more
BNB Long-term Analysis: Ranging
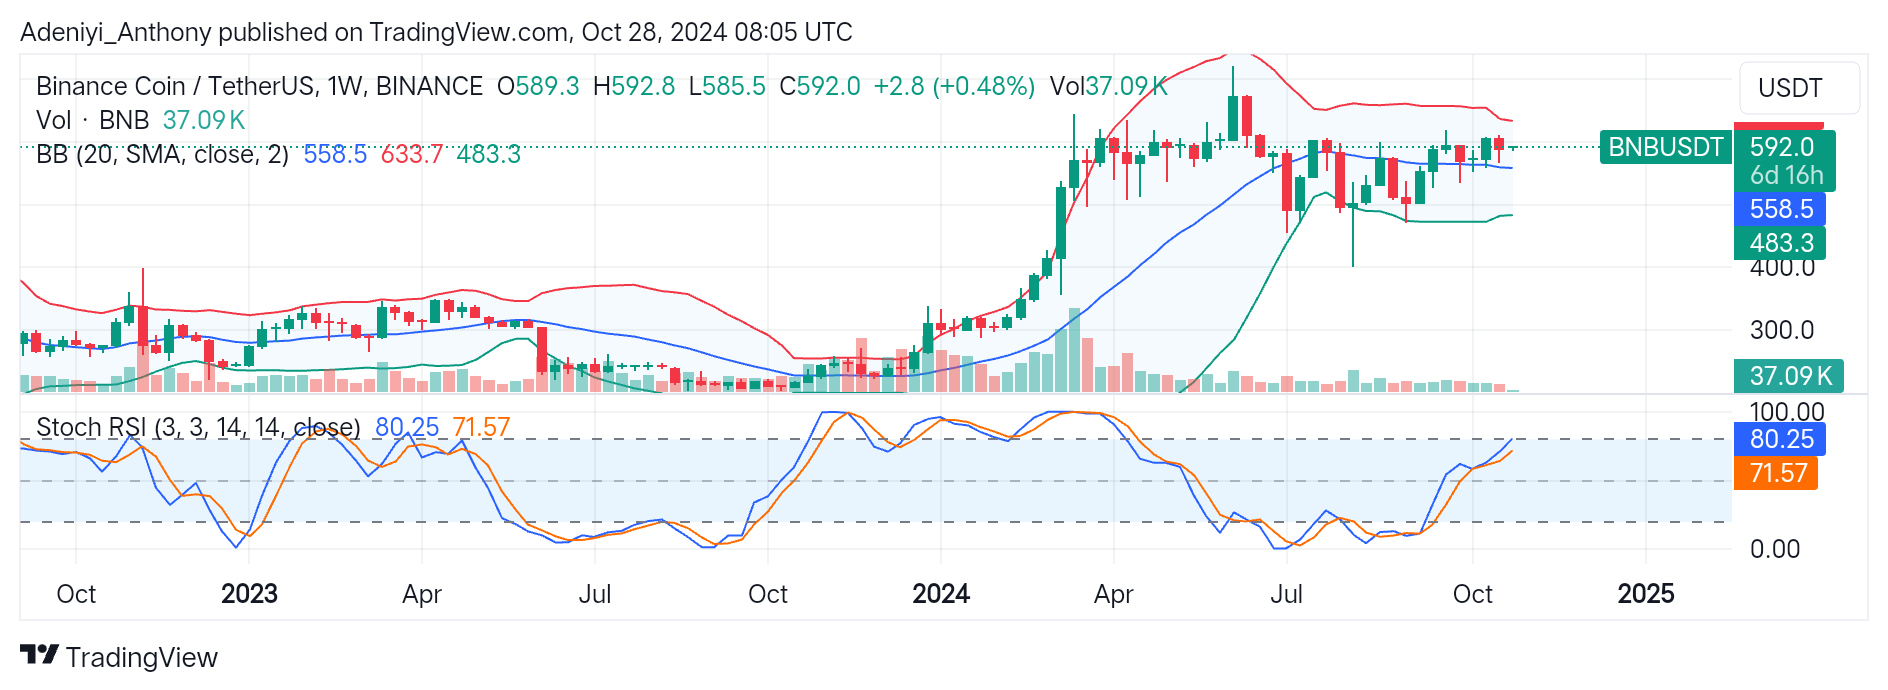
The analysis of the BNB against the Tether on the weekly timeframe shows the pair has had a strong bullish trend around the first quarter of the year. However, the pair has been trapped within a defined range, as depicted in the sideways movement since the second half of April.
The recent price actions suggest the pair is within defined levels due to low trading volume. The market is waiting for a clearer breakout signal, as current price movements lack strong conviction.
Presently, BNB/USDT trades at $592 near the dynamic mid-band at $558.5 with a slight uptick to the north. At this junction, the three scenarios are possible; a break above the psychological $600 to $633 levels will signal a clear direction.
Conversely, prolonged contact with the upper band without strong buying pressure may lead to a continuation of the consolidation phase or a pullback to the south.
Technical Indicators
Major Resistance Levels: $600, $633, and $700
Major Support Levels: $558, $483, and $450
BNB Technical Analysis
Technically, the BNB against the USDT is near the upper Bollinger band, which typically indicates an overbought condition. The prolonged contact with the $633 level could imply overextension, potentially leading to consolidation or correction if resistance stands strong. However, with the low market volatility, there is possibility for a breakout above the upper Bollinger band if bullish traders apply the needed pressure.
The Stochastic RSI presents the pair in an overbought condition, and if this triggers a sell-off, the price might pull back towards the $558 level. This kind of retracement would make BNB/USDT to oscillate further before attempting a downtrend if selling pressure persists.
BNB/USDT Analysis: A Pullback or Continued Uptrend
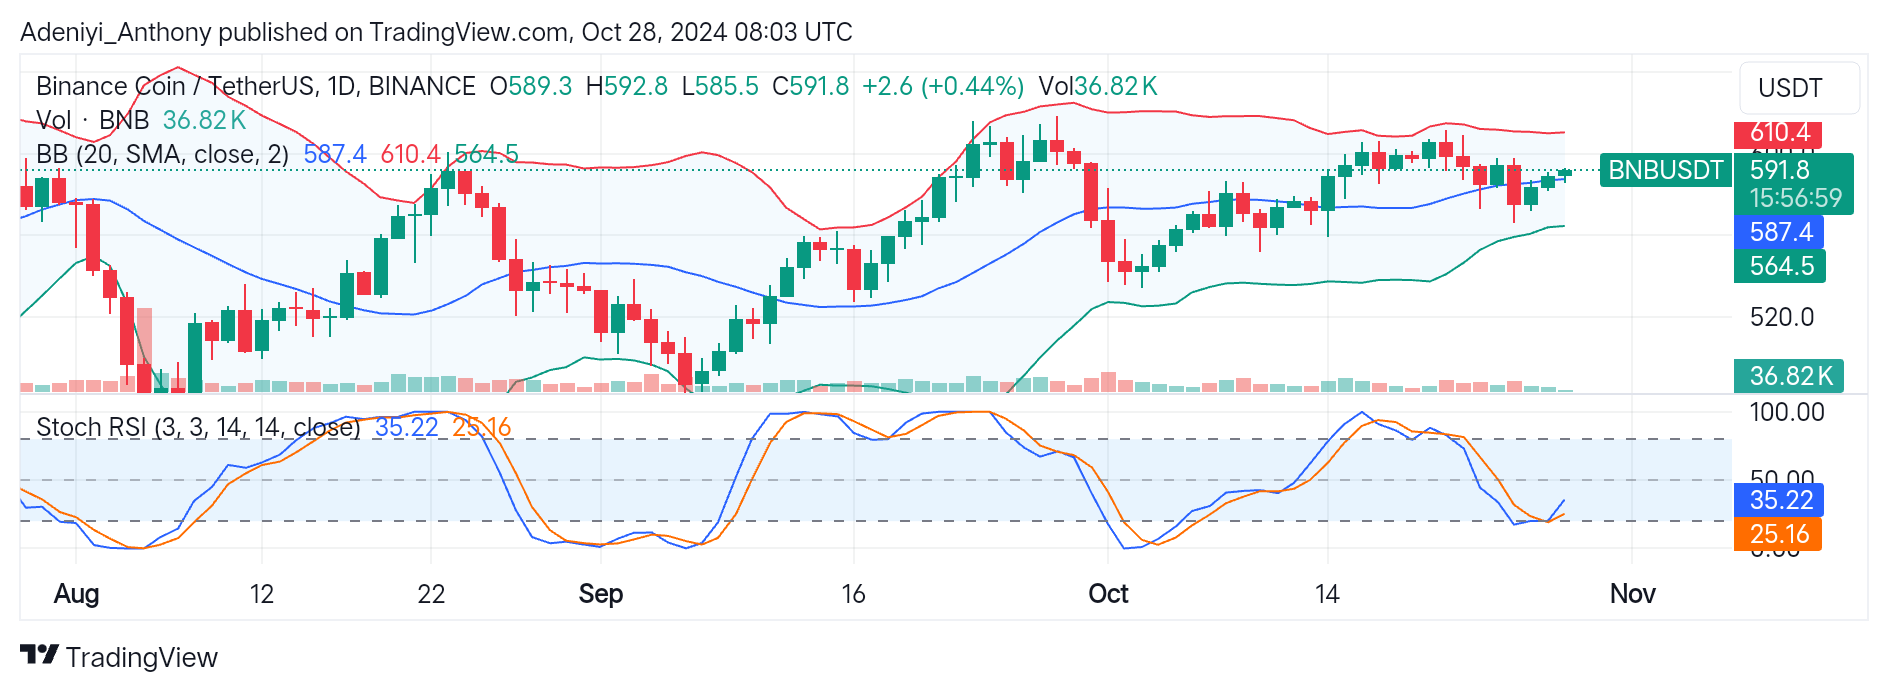
BNB has been consolidating against the USDT around the dynamic mid-band and appears to be poised for an upside breakout. The current movement around the mid-band within a tight range suggests a breakout. However, the little operation between the upper segment of the bands indicates a bullish momentum is gradually building.
The pair in this timeframe is valued at $591.8. However, a break above the $610 level would cement the uptrend; otherwise, a pullback to the mid-band or the lower band is possible.
From the Stochastic side, the lines of the indicator are positioned under the 50-mark level in an oversold region. However, the uptick in the lines suggests that momentum is shifting, hinting at a potential recovery. A buying opportunity will be confirmed above the 50-mark level.
You can purchase crypto coins here. Buy LBlock