BNB (BNB/USDT) Shows Signs of Potential Reversal
Estimated Reading Time: 3 minutes
Don’t invest unless you’re prepared to lose all the money you invest. This is a high-risk investment and you are unlikely to be protected if something goes wrong. Take 2 minutes to learn more
BNB Long-term Analysis: Bullish
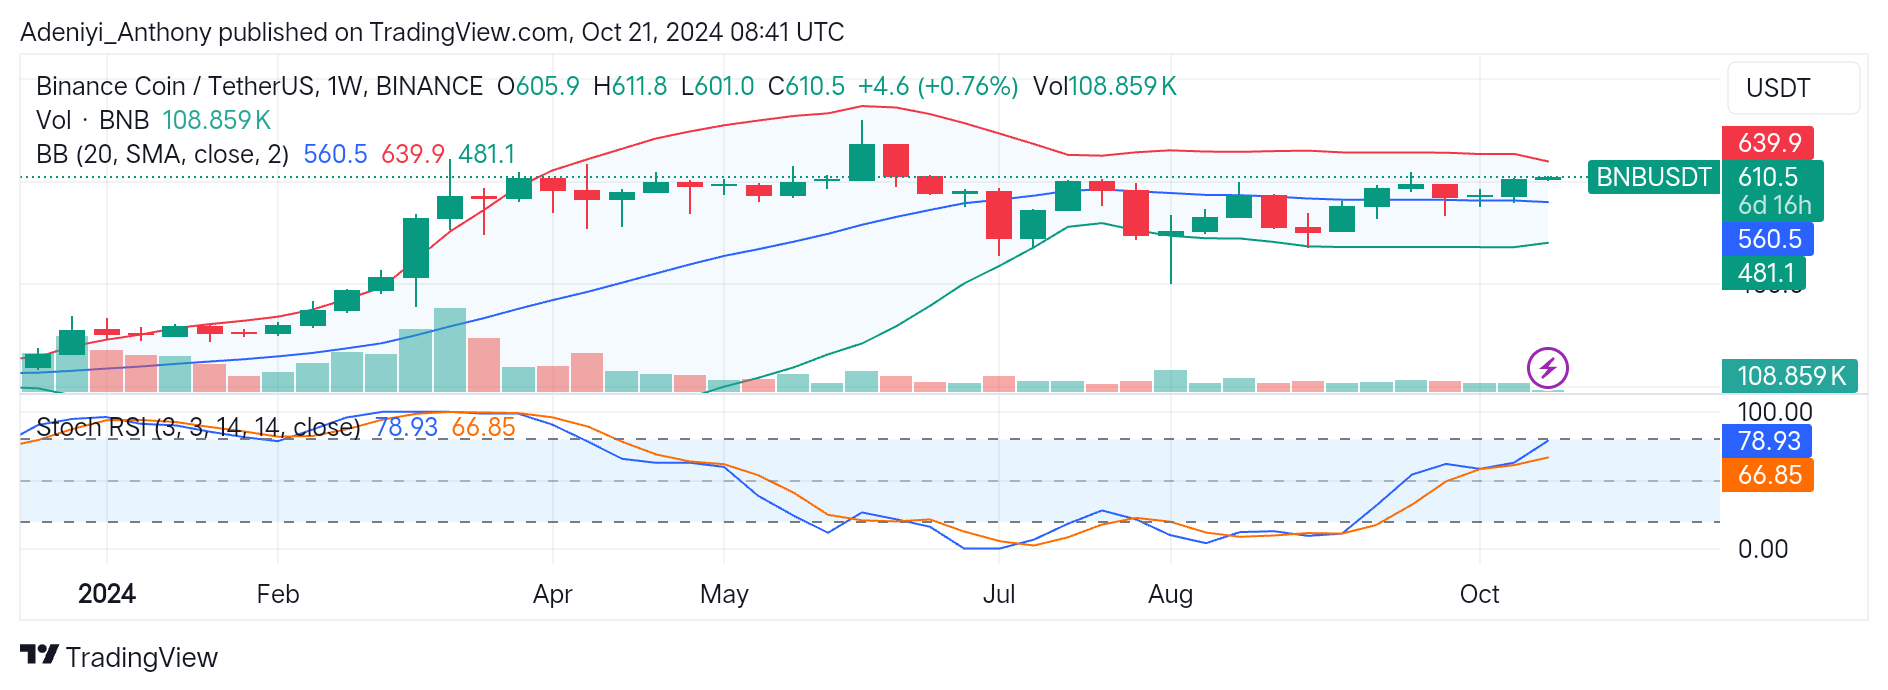
The recent analysis of BNB against the Tether on a weekly timeframe reveals the pair has been on a steady bullish trend. However, the indicators on the chart suggest the pair operates in an overbought condition.
BNB/USDT has seen a lot of improvement since the extended consolidation periods in August and mid-September. Now, the pair has broken past the $560.5 level to approach the $639.9 at the upper band.
At this point, a cautious trade is advised as both the Bollinger bands and the Stochastic oscillator signal a possible pullback is near.
Currently, the pair trades at $610.5, close to a conceivable resistance level at $615. The price will need to break this level for the continuation of the bullish run. Contrarily, if the price fails to hold above the upper band, a retest of the $560.5 level or a short-term reversal may surface.
Technical Indicators
Major Resistance Levels: $615, $625, and $639.9
Major Support Levels: $560.5, $520, and $481.1
BNB Technical Analysis
BNB against the Tether has been hovering just above the mid-band with a slight positive difference from the previous trade. However, more confirmation is needed as the current bullish momentum lacks strong conviction as the volume is relatively low.
The narrow bands suggest the likelihood of price breaking above the immediate resistance line; otherwise, a fall in price will signal a retracement.
On the other hand, the Stochastic RSI signals a potential reversal as the blue line operates in the overbought region while the orange line is near. Traders need to watch out for the $615 and $560.5 levels because whatever happens at these points will determine trade direction.
BNB/USDT Analysis: What’s Next?
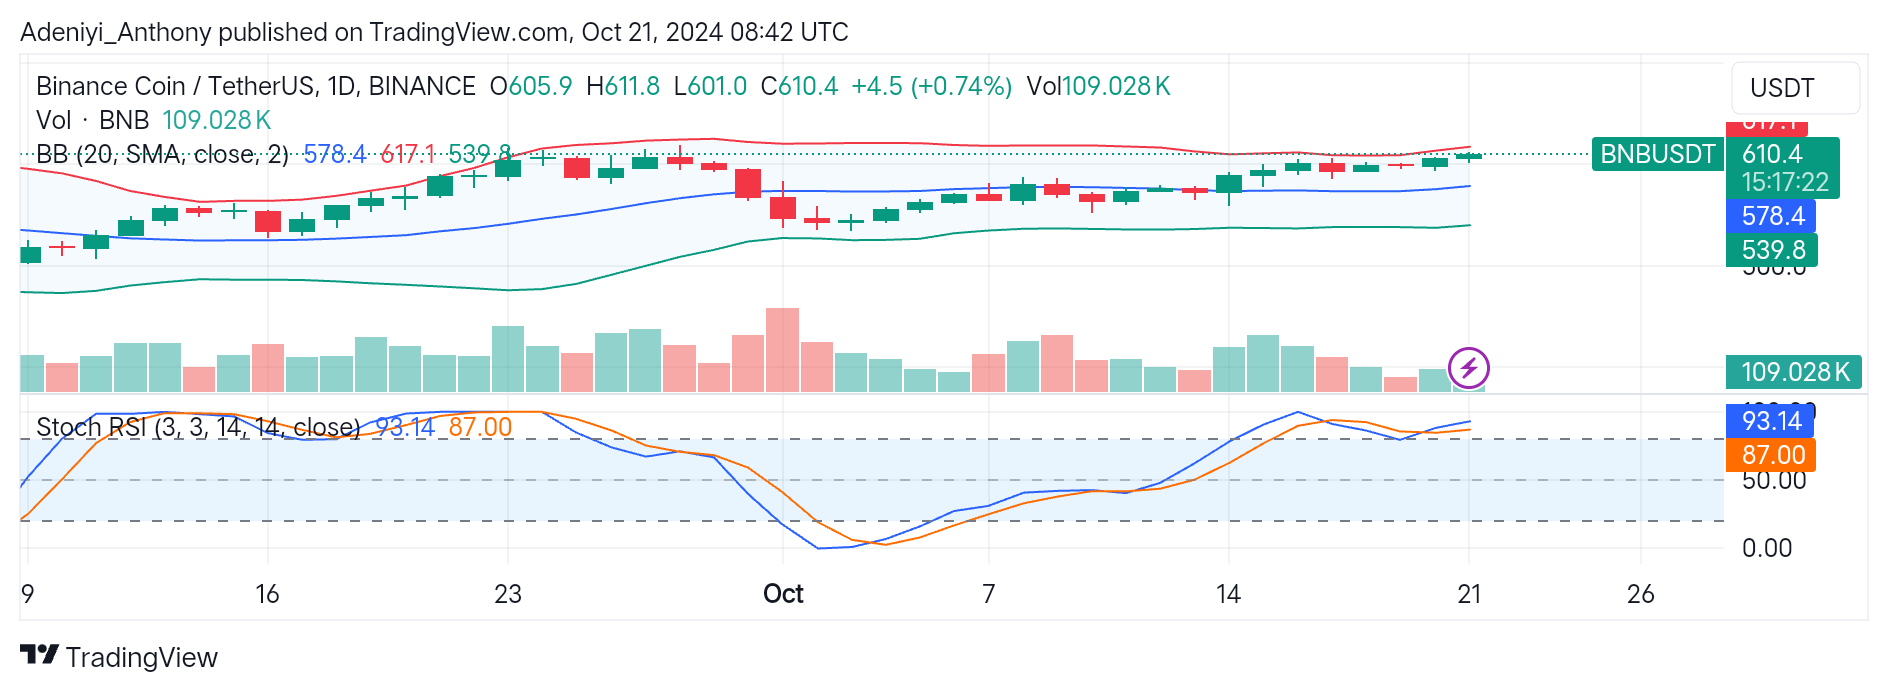
In the daily timeframe, BNB/USDT trading volume is relatively stable, but indicators on the chart signal that a potential reversal may be near.
In this timeframe, the pair trades at $610.4 close to the upper band. However, with the closeness of the bands, the price tends to break out in either direction. A break above the $617.1 level will indicate a continuation of the bullish momentum. On the other hand, if this level becomes too strong, the pair may experience a retracement to the mid-band at $578.4.
On the downside, the Stochastic oscillator suggests the pair is due for a reversal, as both lines of the indicator extend to the right in the deep overbought region. A crossover of the lines may suggest the beginning of a pullback or consolidation phase.
You can purchase crypto coins here. Buy LBlock