Dogecoin (DOGE) Price Prediction: DOGE/USDT Keeps the Bullish Recovery Going
Estimated Reading Time: 2 minutes
Don’t invest unless you’re prepared to lose all the money you invest. This is a high-risk investment and you are unlikely to be protected if something goes wrong. Take 2 minutes to learn more

Date: January 5, 2026
In what seems like a market-wide move, the Dogecoin market has been able to post a meaningful upside price recovery. This move appears to have spanned over five sessions, and further gains may still occur in this market.
DOGE/USDT Long-Term Trend — Bullish (Daily Chart)
Key Price Levels:
Resistance: $0.1600, $0.1700, $0.1800
Support: $0.1500, $0.1400, $0.1300
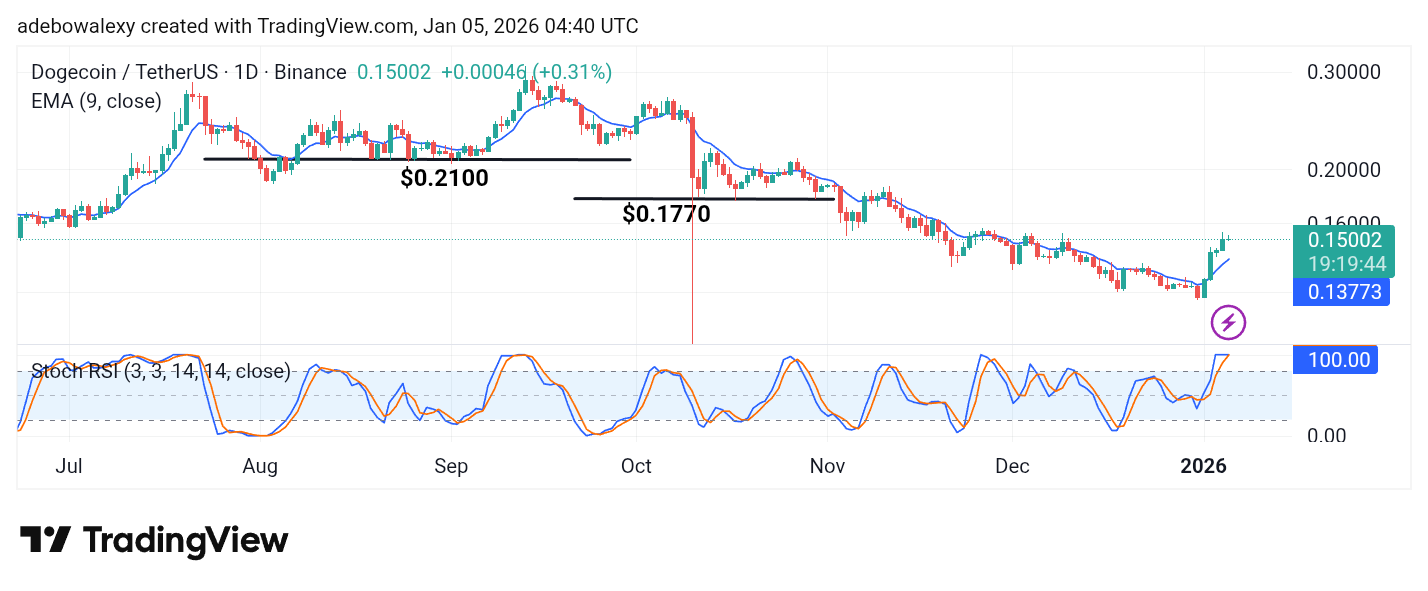
Price activity on the Dogecoin daily chart has moved past key technical landmarks, such as the 9-day Exponential Moving Average (EMA). The ongoing session remains green and continues to trade above the 9-day EMA. Meanwhile, the Stochastic Relative Strength Index (SRSI) indicator lines have reached the 100 mark and are merged at that level. Although this suggests an overbought condition, there are no clear signs yet of an imminent bearish crossover.
Dogecoin (DOGE) Price Prediction: DOGE/USDT Bulls Appear to Face Exhaustion
Although bullish forces remain dominant in the Dogecoin market, some signals suggest that upside momentum may be approaching a crossroads. The most recent price candle remains green but has a very small body.
In addition, the presence of an upper shadow indicates some downward pressure. However, the SRSI indicator lines remain in the overbought region and are still merged, with no clear indication that a bearish crossover has already occurred. Consequently, traders may want to exercise caution at this stage.
Dogecoin (DOGE) Price Prediction: DOGE/USDT Minimal Pullback Remains at Bay (4-Hour Chart)
What is observed on the daily chart is also evident on the Dogecoin 4-hour chart. The latest price candle is red and has a size that nearly erases the gains from the previous session. Nevertheless, price action continues to trade above the 9-day EMA.
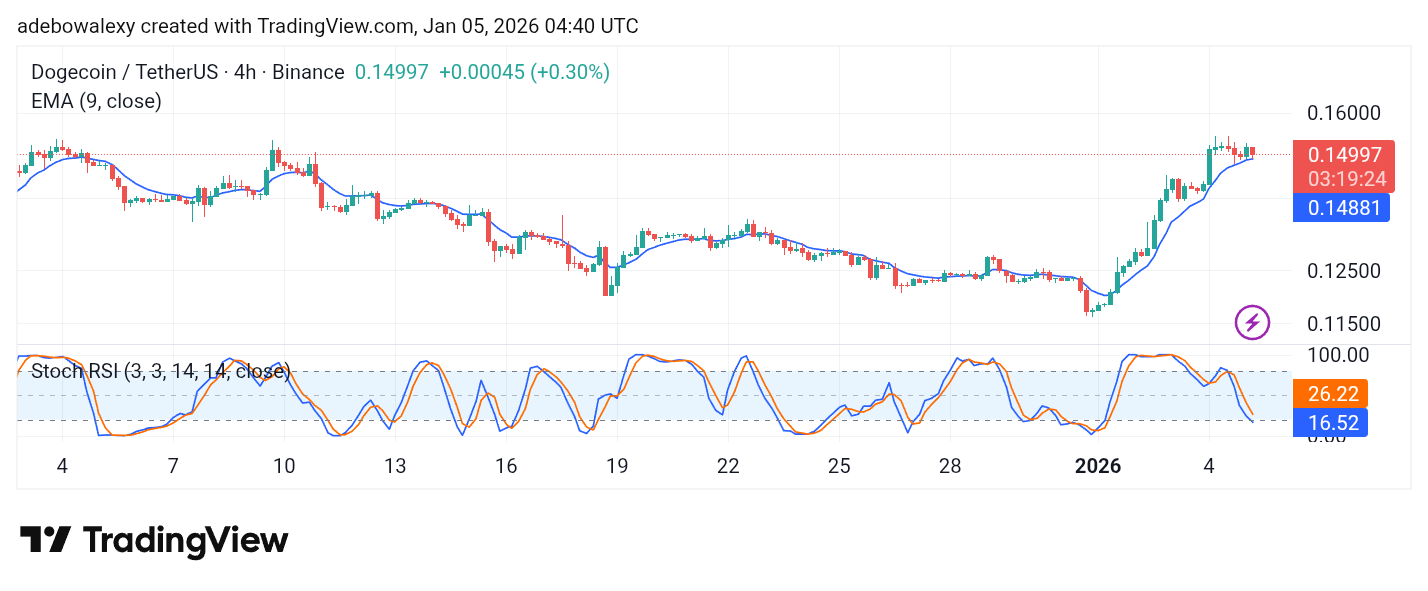
Meanwhile, the SRSI indicator lines are descending toward the oversold region. However, the lines appear slightly tilted toward a potential bullish crossover. Technically, a rebound could occur off the 9-day EMA, and while traders may anticipate a brief pullback, the market could still advance toward the $0.1700 price level.