OFFICIAL TRUMP (TRUMP/USDT) Remains Directionless as Momentum Stabilizes
Estimated Reading Time: 2 minutes
Don’t invest unless you’re prepared to lose all the money you invest. This is a high-risk investment and you are unlikely to be protected if something goes wrong. Take 2 minutes to learn more

The market sentiment for Official Trump against Tether seems to be slightly bullish at the moment, as the price shows no clear direction within narrowed Bollinger Bands. However, this could be either a break to the south or north depending on impending participation, as the Bollinger Bands suggest a breakout or breakdown is imminent and close.
At the moment the pair is consolidating, with the market looking for direction. The next move will depend on how the price will react to key levels, as daily volume shows no spike.
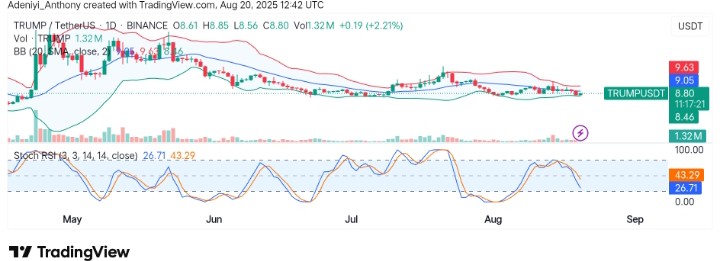
Currently, Official Trump trades at $8.800 with 1.32 million traded volumes for the day.
Technical Indicators
Major Resistance Levels: $8.830, $9.050, and $9.630
Major Support Levels: $8.460, $8.000, and $7.500
TRUMP Technical Analysis
Technically, the Official Trump against Tether is ranging within a close region of the Bollinger Bands as seen on the daily chart. However, the market appears to be neutral, but the MACD beneath the chart shows the pair is on a bearish divergence despite moderate participation.
To this end, if the pair breaks below the price below $8.600 in the near term, further retracement towards $8.460 may be seen. Conversely, a breakout above $8.830 would indicate a return of bullish momentum.
TRUMP/USDT Analysis: A Short-term Expansion or Further Correction?
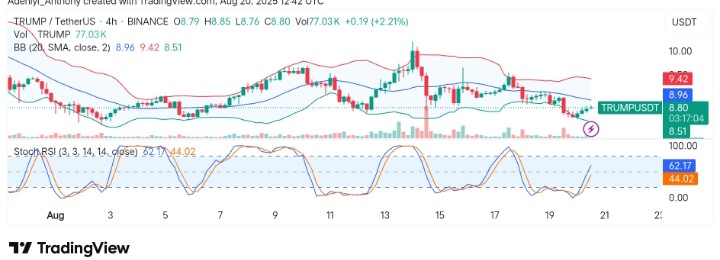
On the 4-hour timeframe, TRUMP/USDT is currently trading towards the dynamic line of the Bollinger Bands after testing the support at $8.530. The MACD and Stochastic RSI shows the bulls are gradually recovering lost positions as the current prices remain feeble considering the volume.
As it stands, the 20-period SMA acts as the dynamic resistance at $8.980, and a break above this level would signify further upside movement as the market approaches a crossroad.
You can purchase crypto coins here. Buy Crypto