OFFICIAL TRUMP (TRUMP/USDT) Targets a Breakout Above a Critical Level
Estimated Reading Time: 3 minutes
Don’t invest unless you’re prepared to lose all the money you invest. This is a high-risk investment and you are unlikely to be protected if something goes wrong. Take 2 minutes to learn more

In recent times, the price movement of Official Trump against Tether has shown strong bullish momentum, currently facing key resistance levels. Till this moment, the price is still trending upside towards $10.27, where the upper Bollinger Band is located, as the market experiences increasing influx of bullish traders. However, technical indicators on the charts are suggesting the price could face a short-term pullback as the pair looks seemingly overbought.
To this end, the price action suggests a continued uptrend, but the indicators suggest caution.
Currently, Official Trump trades at $9.56 with 3.52 million traded volumes for the day.
Technical Indicators
Major Resistance Levels: $10.27, $11.00, and $12.57
Daily Chart Analysis: $9.29, $8.30, and $7.50
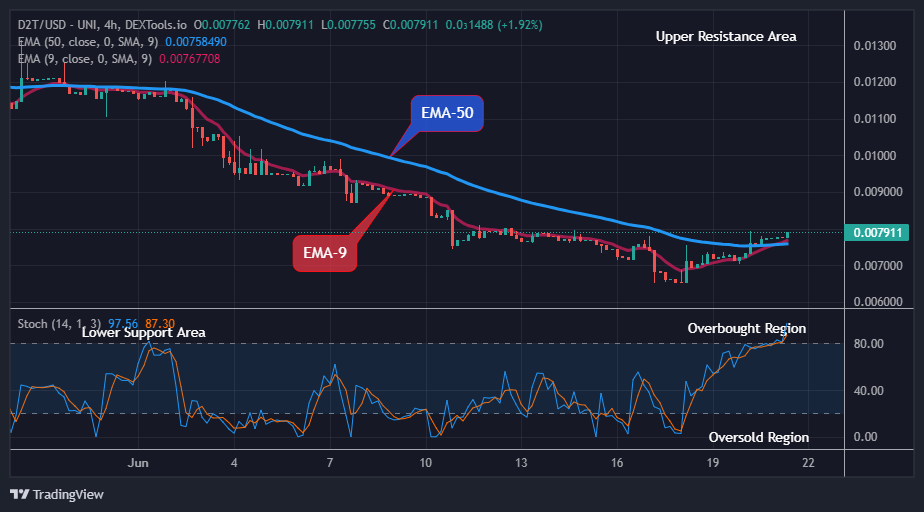
Official Trump Technical Analysis
The daily chart of Official Trump against Tether shows that the pair is on a strong upward movement, testing critical resistance levels with the price hovering near the upper Bollinger Band, indicating bullish momentum. Also, the volume has been increasing, confirming the current uptrend.
However, Stochastic RSI beneath the chart appears to be in the overbought zone, warning of potential price corrections as the indicator’s lines head deep into the overbought region.
To this end, if the pair can manage to break above $9.59 in the current session, gains towards the $11.00 level might materialize.
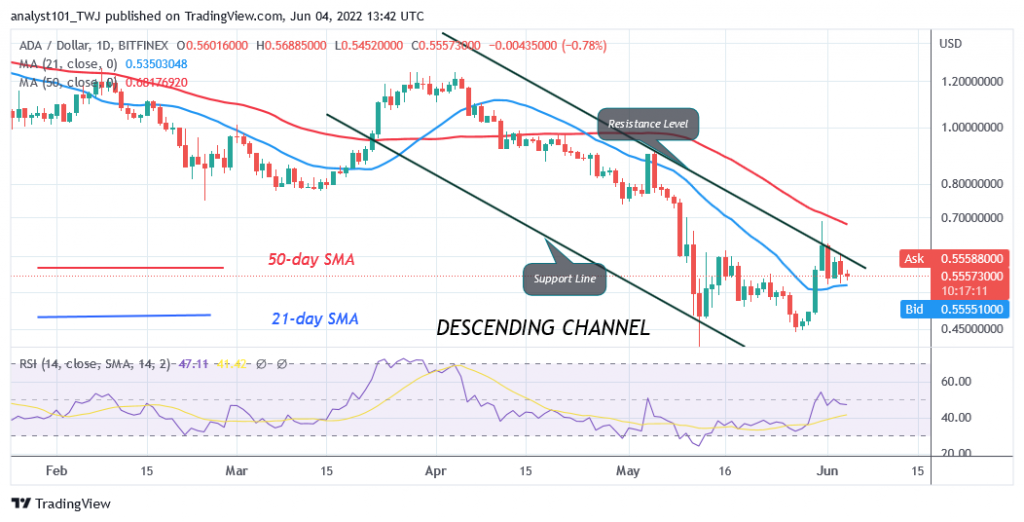
TRUMP/USDT Analysis: Pushing the Frontiers
On the 4-hour chart, TRUMP/USDT analysis shows a similar bullish momentum as seen in the daily chart, with the price trending steadily to the north with expanding bands, which signifies higher volatility.
However, the Stochastic RSI beneath the chart is in the overbought zone, signaling caution, even if the volume indicates strong buying pressure.
To this end, a breakout above $9.60 could lead to further price gains, while a failure to break above could result in a retracement toward immediate support levels.
You can purchase crypto coins here. Buy Crypto