OFFICIAL TRUMP (TRUMP/USDT) Prepares for Potential Reversal Amid Bearish Trend
Estimated Reading Time: 3 minutes
Don’t invest unless you’re prepared to lose all the money you invest. This is a high-risk investment and you are unlikely to be protected if something goes wrong. Take 2 minutes to learn more

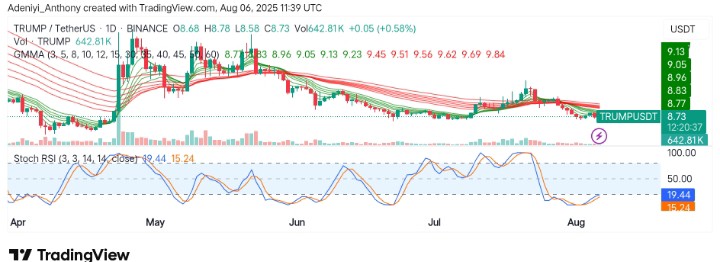
The market for Official Trump against the Tether remains predominantly bearish as seen on the daily chart over an extended period. Also, the price has been trending lower since its peak in the first part of this year. However, the current price action suggests a potential bottom formation and divergence in the current trend, as the Stochastic RSI signals that a reversal is around the corner.
In recent times, the price appears to be trading within $8.00 and $9.00, forming a consolidation zone after a steady decline, indicating a pause in the overall market trend. To this end, the Guppy Multiple Moving Averages (GMMA) still present a bearish outlook with short-period EMAs operating underneath the long-period EMAs. However, the momentum indicator suggests a reversal might be near despite the oversold condition.
Currently, Official Trump trades at $8.73 with over 642K traded volumes for the day already.
Technical Indicators
Major Resistance Levels: $8.96, $9.34, and $10.50
Major Support levels: $8.60, $8.10, and $7.50
OFFICIAL TRUMP Technical Analysis
On the daily timeframe, the analysis of the Official Trump against the Tether appears to be losing bearish momentum as the overall price action suggests a bottoming pattern. However, the positioning of the GMMA shows the bears still hold some fragment of the market despite a bullish attempt to usurp the dominance.
From another angle, the indication provided by the Stochastic RSI pictures a market recovering from an oversold condition with a steady increase in volume, suggesting more gains in the long run if more bullish actions are involved.
To this end, with strong support at $8.60, a bounce at this level would indicate a move towards $8.96 and beyond; the pair risks further decline if a breakdown occurs at this level.
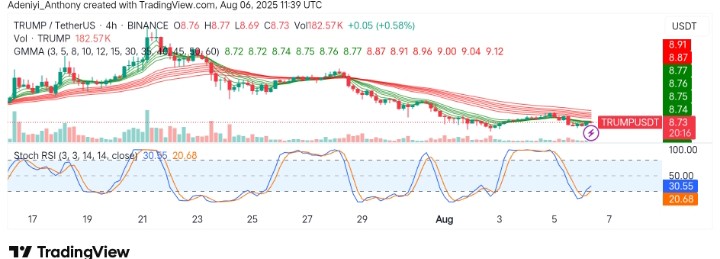
TRUMP/USDT Analysis: A Potential Price Reversal or Continued Downtrend?
On the 4H chart, the analysis of TRUMP/USDT shows a market with a bearish outlook and alignment as indicated by the GMMA. However, the oscillator beneath the chart signals the market might recover soon, but the volume appears to be in favor of the bears, indicating a short-term bearish action might be recorded before any price recovery.
To this end, the $8.60 looks like strong support that could trigger a reversal towards $8.96, but a break below this level would indicate a continued downtrend.
You can purchase crypto coins here. Buy LBlock