Official Trump (TRUMP/USDT) Faces Severe Downtrend Pressure Amidst Critical Levels
Estimated Reading Time: 3 minutes
Don’t invest unless you’re prepared to lose all the money you invest. This is a high-risk investment and you are unlikely to be protected if something goes wrong. Take 2 minutes to learn more

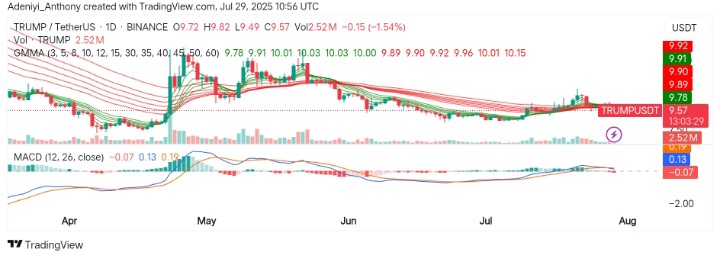
The overall market sentiment for Official Trump against Tether seems to be bearish based on recent price action. However, with the price showing a strong downtrend since mid-July, the candlestick formation suggests a possible continuation of this southbound movement, as evidenced by the dominance of red candles on the chart.
The MACD appears to be pointing in the same direction, exhibiting a negative divergence as seen in the histogram and MACD line.
From another perspective, the Guppy Multiple Moving Average (GMMA) confirms the ongoing bearish sentiment. However, consolidation around $9.50 and $9.60 can be noticed, indicating that buyers are attempting to defend that support zone, but selling pressure continues to outweigh it.
To this end, Official Trump trades at $9.57, recording over 2.5 million traded volumes for the day.
Technical Indicators
Major Resistance Levels: $9.82, $9.91, and $10.01
Major Support Levels: $9.49, $9.30, and $9.00
Official Trump Technical Analysis
Given the recent price action and the GMMA’s indication of a long-term bearish trend, the analysis of Official Trump against Tether shows that a short position near the support level of $9.45 could be seen as the MACD and volume display bearish sentiment. However, entry could be confirmed if the pair’s price hit below this level.
From another angle, it appears the price still consolidates between $9.49 and $9.82; the former can be a nice entry point for bulls to reclaim $9.82. However, if the downtrend continues, the pair may extend towards $9.00 in the near term.
TRUMP/USDT Analysis: What’s Next?
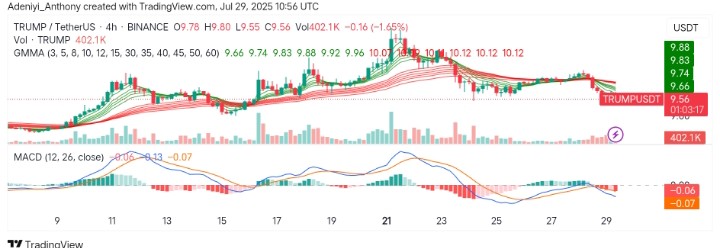
On the 4-hour chart for TRUMP/USDT, the price action shows a downtrend since July 21st, with a clear breakdown below key levels. However, the current price action appears to be testing the $9.50 support zone, as the MACD, which continues to stay below the zero line, suggests strong bearish pressure.
On the other hand, the GMMA also shows a bearish alignment, with the long-term EMAs still positioned above the short-term EMAs. This indicates that sellers are in control in the medium term.
To this end, further downside is expected if the price breaks below $9.49; otherwise, with an increasing volume, a close above $9.60 would suggest revived bullish momentum.
You can purchase crypto coins here. Buy LBlock