Lucky Block Price Prediction: LBLOCK/USD Prepares for a Bullish Movement
Estimated Reading Time: 3 minutes
Don’t invest unless you’re prepared to lose all the money you invest. This is a high-risk investment and you are unlikely to be protected if something goes wrong. Take 2 minutes to learn more

Free Crypto Signals Channel
The Lucky Block price prediction shows that LBLOCK is moving to form higher as the bulls are ready to push the coin to the upside.
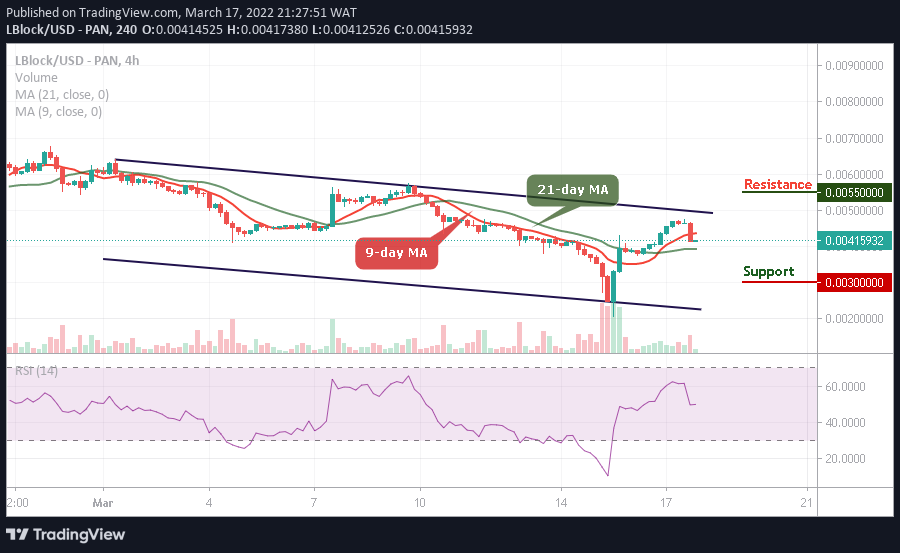
LBLOCK/USD Medium-term Trend: Ranging (4H Chart)
Key Levels:
Resistance levels: $0.0055, $0.0060, $0.0065
Support levels: $0.0030, $0.0025, $0.0020
At the time of writing, LBLOCK/USD is moving sideways as the market price prepares to cross above the 9-day moving average. Meanwhile, the buyers are preparing the coin for the higher levels. However, new buyers are expected to come into the market should the coin touches the nearest support level of $0.0040.
Lucky Block Price Prediction: LBLOCK/USD Would Spike to the Upside
The Lucky Block price would rise and break above the upper boundary of the channel immediately the bulls defends the $0.0040 support level. However, any further bullish movement to the upside may push the price to the potential resistance levels of $0.0055, $0.0060, and $0.0065.
Moreover, the Lucky Block market may wait for spike higher if the bears break below the 21-day moving average to touch the support levels of $0.0030, $0.0025, and $0.0020 as the technical indicator Relative Strength Index (14) moves around 50-level to give more bullish movements in the next positive directions.
LBLOCK/USD Medium-term Trend: Ranging (2H Chart)
According to the chart, the Lucky Block price is ranging below the 9-day and 21-day moving averages. The bullish are seen gathering momentum in other to push the coin above the upper boundary of the channel. The long-term moving averages may keep the bullish movement as the market prepares for a new trend.
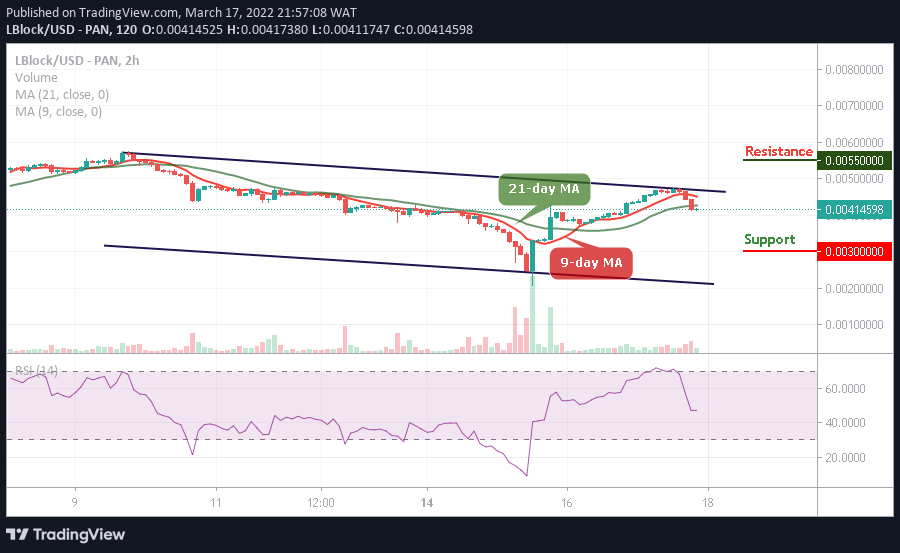
However, the buyers would push the price and move towards the upper boundary of the channel, higher resistance could be reached at $0.0055 and above while the technical indicator Relative Strength Index (14) stays below 50-level, indicating that the buyers are getting ready for a spike to the positive side. On the contrary, if the bulls fail to move the current market value above, the bears may bring the market to the support level of $0.0030 and below for new buyers to buy the dip.
Read more: