DeFi Coin Price Prediction: DEFC/USD Ranges as the Coin Prepares for the Upside
Estimated Reading Time: 2 minutes
Don’t invest unless you’re prepared to lose all the money you invest. This is a high-risk investment and you are unlikely to be protected if something goes wrong. Take 2 minutes to learn more

Free Crypto Signals Channel
The DeFi Coin price prediction reveals that if bulls begin to increase their momentum, the price would cross above the moving averages.
DEFC/USD Medium-term Trend: Ranging (12H Chart)
Key Levels:
Resistance levels: $0.36, $0.38, $0.40
Support levels: $0.30, $0.28, $0.26
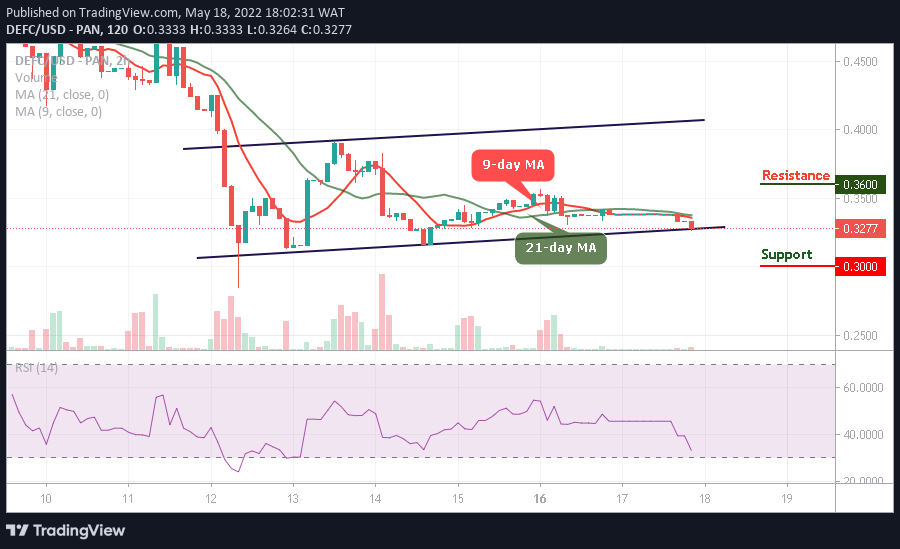
At the time of writing, DEFC/USD is moving sideways as the coin prepares to break above the 9-day and 21-day moving averages. Meanwhile, the bullish momentum will propel the coin to move towards the $0.35 resistance level as bullish pressure could break this level. However, if the bulls fail to drive the price higher, the DeFi Coin price may consolidate for some time.
DeFi Coin Price Prediction: DEFC/USD Would Head to the Upside
The DeFi Coin price is changing hands at $0.32 where it will begin to face the upside. However, if the coin crosses above the 9-day and 21-day moving averages, the coin will locate the potential resistance levels at $0.36, $0.38, and $0.40 while the support levels remain at $0.30, $0.28, and $0.26 for the new entries t come into the market as the technical indicator Relative Strength Index (14) moves below 35-level.
DEFC/USD Medium-term Trend: Bearish (4H Chart)
The DeFi Coin price is sliding below the 9-day and 21-day moving averages while the technical indicator Relative Strength Index (14) is within the oversold region. This will be the best time for more buyers to buy the dip before the coin head to the upside However, any bullish movement above the channel may hit the resistance level at $0.35 and above.
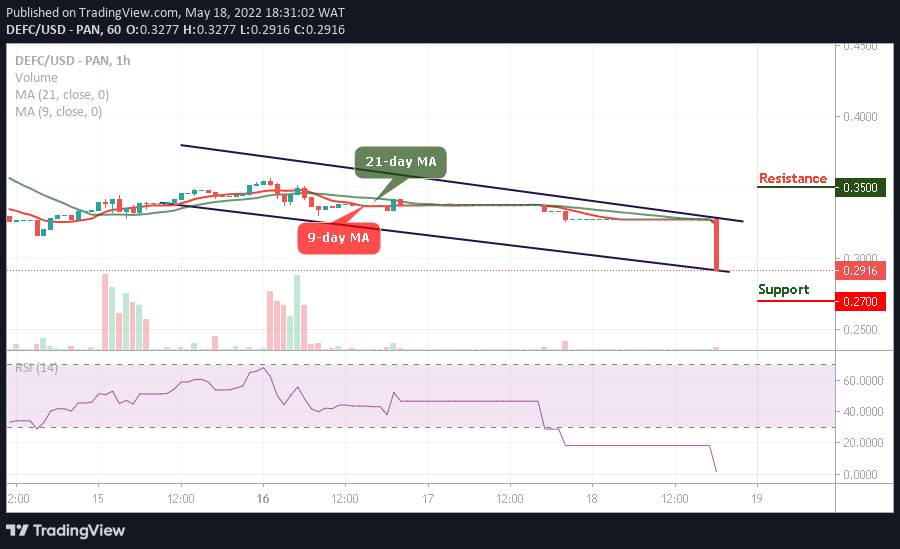
Nevertheless, DEFC/USD may continue to display some bearish signals, and once this happens, the market may cross below the lower boundary of the channel, which may likely hit the critical support at $0.27 and below.
You can purchase DeFi Coin here. Buy DEFC