DeFi Coin Price Prediction: DEFC/USD Ranges as More Buyers to Come Into Focus
Estimated Reading Time: 2 minutes
Don’t invest unless you’re prepared to lose all the money you invest. This is a high-risk investment and you are unlikely to be protected if something goes wrong. Take 2 minutes to learn more

Free Crypto Signals Channel
The DeFi Coin price prediction shows that DEFC would begin to form higher as the coin remains around the moving averages.
DEFC/USD Medium-term Trend: Ranging (2H Chart)
Key Levels:
Resistance levels: $0.39, $0.41, $0.43
Support levels: $0.28, $0.26, $0.24
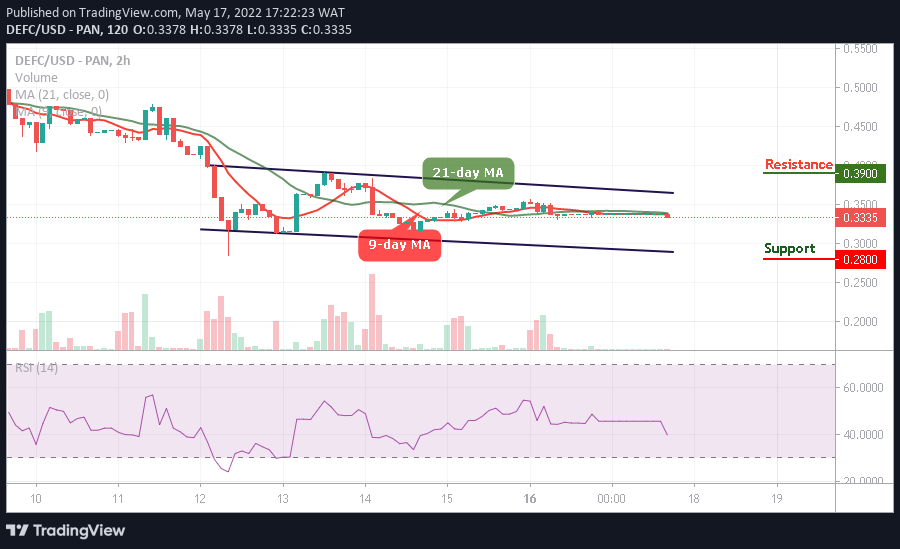
DEFC/USD is trading within the 9-day and 21-day moving averages as the bulls are getting ready to push the coin to the upside. The DeFi Coin price may consolidate a little to allow more buyers to come into the market.
DeFi Coin Price Prediction: Green Days Are Coming for DEFC/USD
The DeFi Coin price would break above the 21-day moving average as soon as the bulls defend the $0.32 support level. Therefore, any further bullish movement towards the upper boundary of the channel may push the coin to the potential resistance levels of $0.39, $0.41, and $0.43.
For now, this technical analysis may be delayed if the bears keep the coin below the moving averages and could fall to the support levels of $0.28, $0.26, and $0.24. Moreover, the technical indicator Relative Strength Index (14) is likely to cross below the 40-level preparing the coin for the bullish movement.
DEFC/USD Medium-term Trend: Ranging (30M Chart)
When compared to the 30-minute chart, the DeFi Coin price would move up higher as the coin gets ready for a cross above the upper boundary of the channel. However, the long-term moving averages may keep the bullish movement as the market prepares for a new trend.
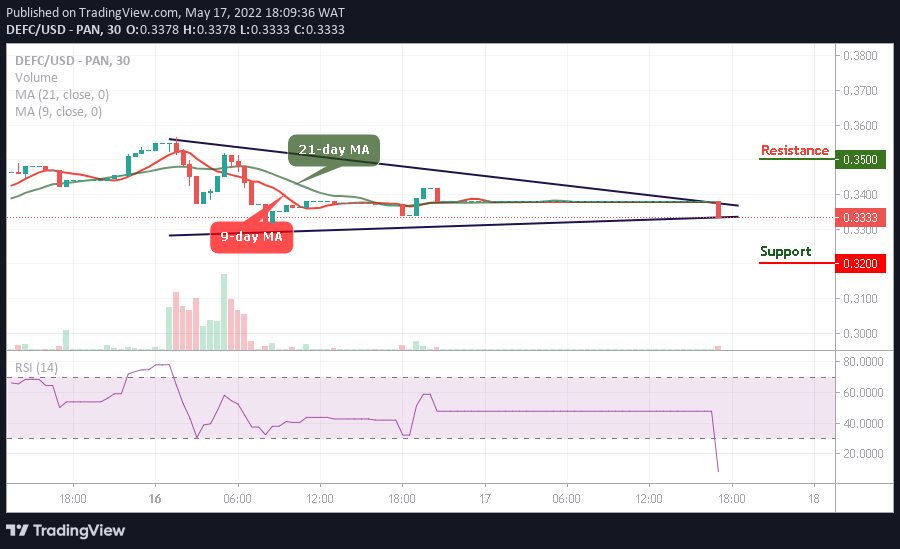
On the other hand, if the buyers push the price above the 9-day and 21-day moving averages; higher resistance would be located at $0.0035 and above. However, the technical indicator Relative Strength Index (14) moves into the oversold region, and should the bulls fail to move the current market value up, the bears may step into the market, and the nearest support level could be found at $0.0032 and below.
You can purchase DeFi Coin here. Buy DEFC