Ethereum (ETH/USD) Stretches Towards $3,900 Amid Overbought Signal
Estimated Reading Time: 3 minutes
Don’t invest unless you’re prepared to lose all the money you invest. This is a high-risk investment and you are unlikely to be protected if something goes wrong. Take 2 minutes to learn more
Ethereum Long-term Analysis: Bullish
Ethereum has displayed strong bullish momentum in recent weeks, with price breaking above critical resistance levels. This connotes high investors’ confidence in the possibility of breaking above $3,900 for the $4,000 psychological level.
ETH price over the past weeks has moved decisively towards the North, supported by increased trading volumes. However, this bullish sentiment is further reinforced by the breakout from the consolidation phase at near $2,800; the overbought condition presented by the Stochastic RSI suggests the pair may need to retrace a little before further uptrend.
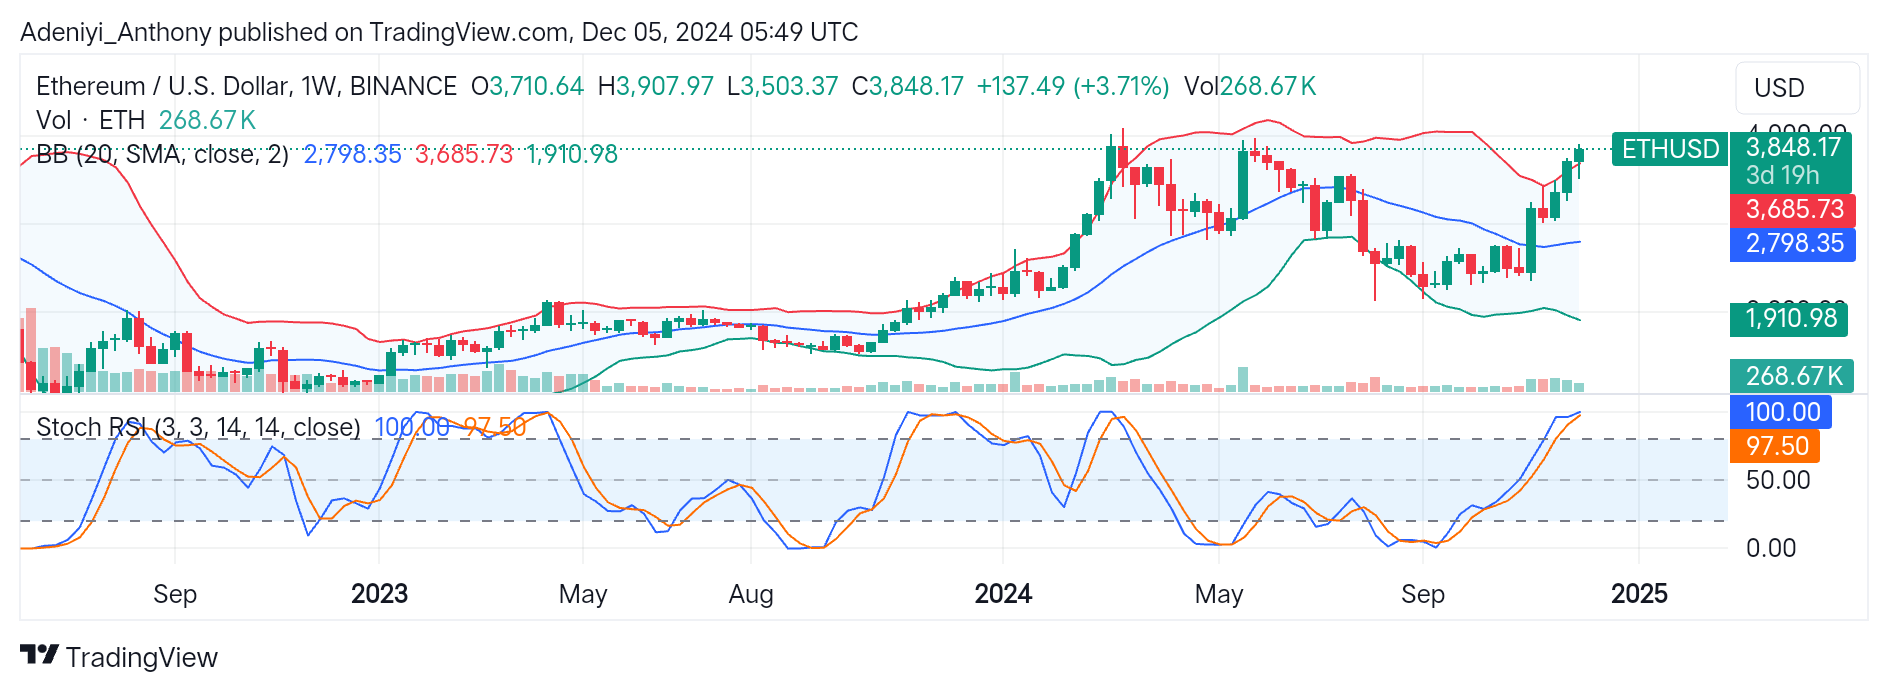
Currently, Ethereum is trading at a multi-month high of $3,848.17 with 268.67K traded volumes.
Technical Indicators
Major Resistance Levels: $3,900, $4,000, and $4,300
Major Support Levels: $3,685, $2,795, and $2,100
Ethereum Technical Analysis
The analysis of Ethereum (ETH) against the United States Dollar (USD) on a weekly timeframe shows the pair has been on a bullish trend for some time, with the price suspending above the upper Bollinger band and reaching the $4,000 level. Though the expansion of the signals increased volatility, the activity of the price above the upper band indicates the pair is overbought. Therefore, there might be a short-term retracement below the $3,685 level before further upside movement.
Additionally, the Stochastic RSI shows that the pair’s trend is extremely bullish with lines reading above the 95-mark level. This condition reflects an extreme buying interest, but the oscillator signals a potential correction if momentum wanes. To this end, breaking above $4,000 is attainable provided trading volume increases; otherwise, a dip below $3,685 may signal the beginning of a decline back to other support levels.
ETH/USD Analysis: A Pullback or Continued Uptrend?
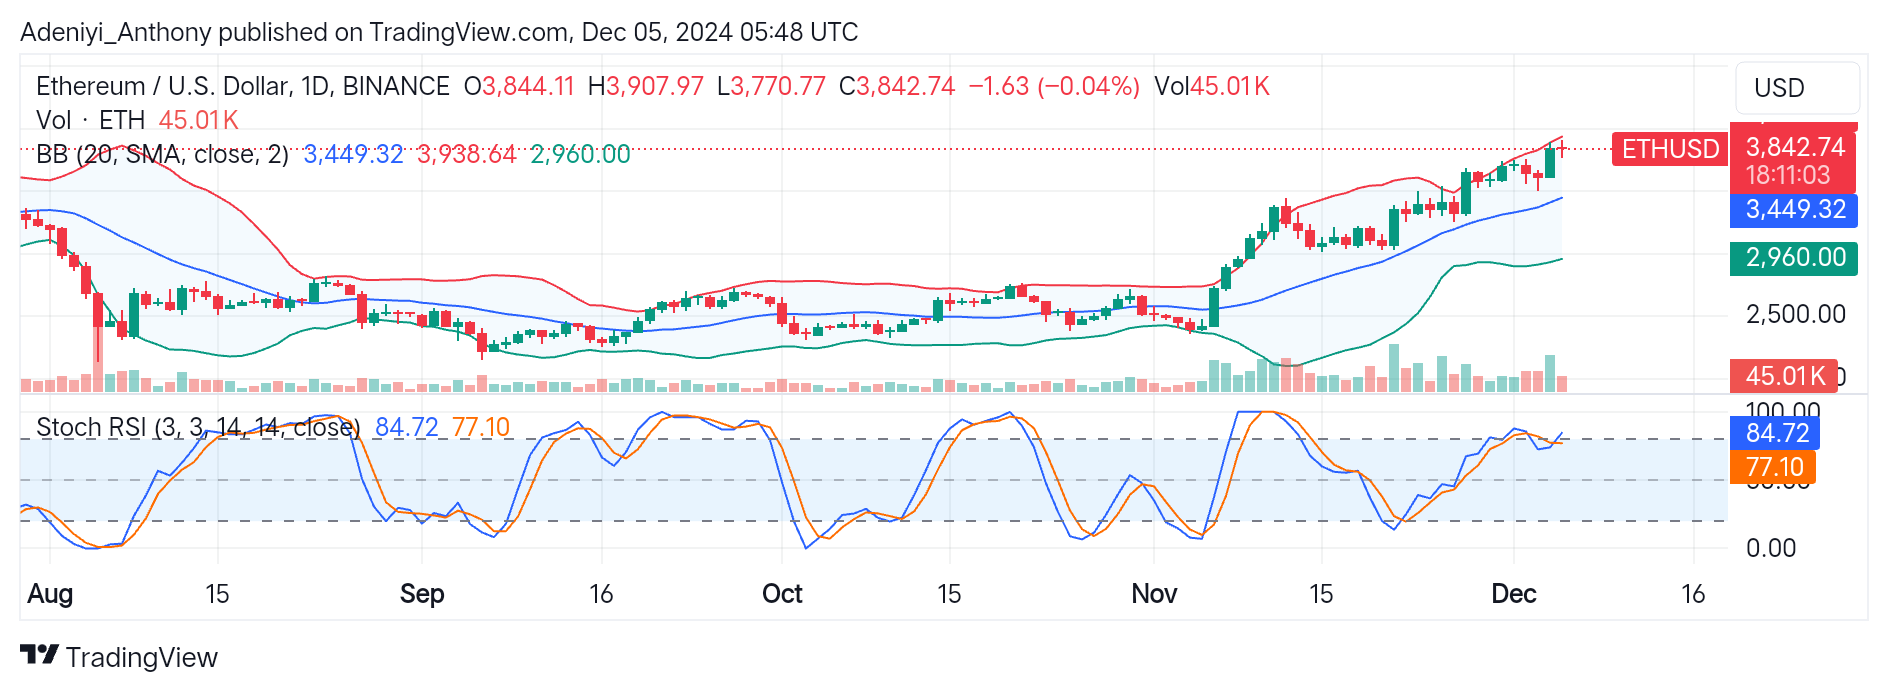
ETH/USD on a daily timeframe is positioned for further gains with the expansion of the Bollinger bands, which signifies increased volatility. However, the overbought condition on the Stochastic RSI signals that a short-term retracement may occur. Traders must trade cautiously, as a sustained move below $3,450 would lead to a retest of deeper support levels at $2,960.
On the contrary, as ETH/USD continues to form a higher high, the current trading volume in this timeframe is steady but not elevated. Therefore, a spike in volume is needed to break beyond the current resistance towards $4,000.
You can purchase crypto coins here. Buy Block