Dogecoin (DOGE) Price Prediction: DOGE/USDT Clinches Minor Profits
Estimated Reading Time: 3 minutes
Don’t invest unless you’re prepared to lose all the money you invest. This is a high-risk investment and you are unlikely to be protected if something goes wrong. Take 2 minutes to learn more

Dogecoin Price Prediction: March 17
After price action in the Dogecoin market fell below the $0.2000 price level, volatility appears to have decreased. At this point, traders seem increasingly cautious, creating headwinds in this market.
DOGE/USDT Long-Term Trend: Bearish (Daily Chart)
Key Price Levels:
Resistance: $0.2000, $0.2200, $0.2400
Support: $0.1700, $0.1500, $0.1300
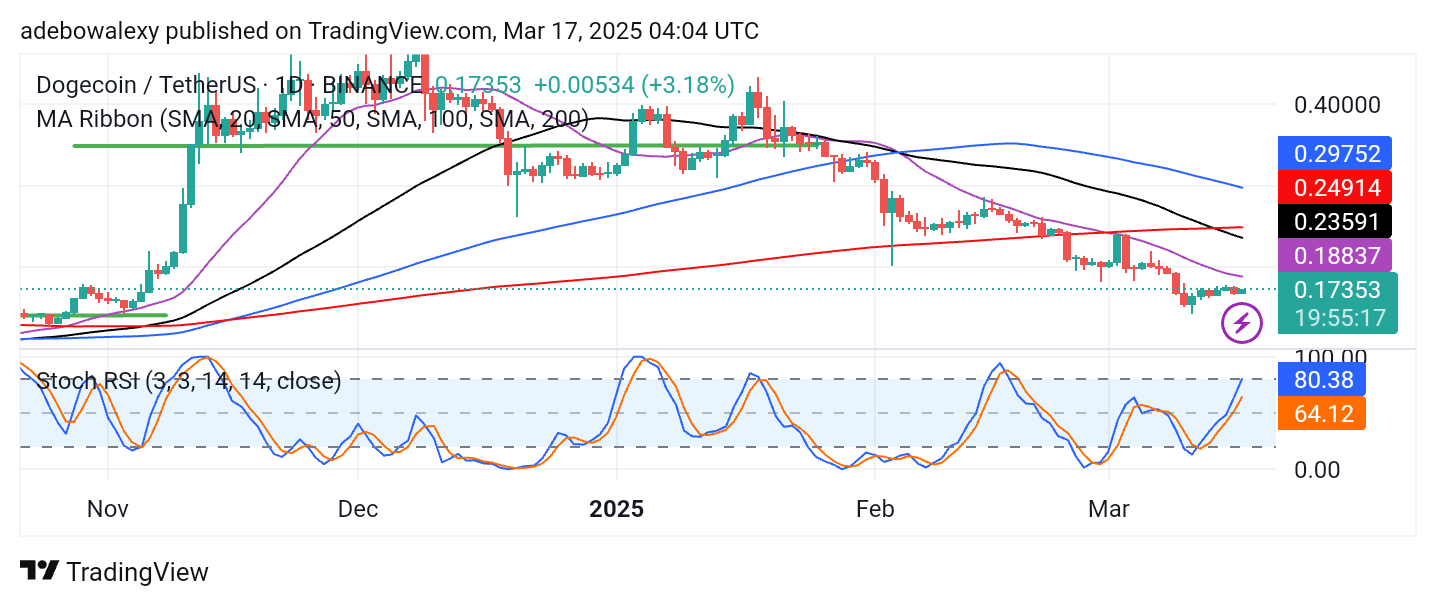
More recently, price activity in this market has been rising steadily and slowly toward the $0.2000 price level. However, this movement remains sluggish, as price action continues to trade below all the Moving Average (MA) lines on the chart. The latest price candle is green but has shown only minimal upside movement. Additionally, the Stochastic Relative Strength Index (RSI) lines have risen past the 50 mark, with the lead line now at the 80 threshold and the lagging line just above the 60 level.
Dogecoin Price Prediction: The $0.2000 Level Presents Strong Resistance in the DOGE/USDT Market
Price action in the Dogecoin daily market has struggled ever since it fell below the $0.2000 price level. As a result, bulls have recorded only minimal gains. Trading activity remains below all the MA lines, reinforcing a bearish sentiment in this market.
Meanwhile, the Stochastic RSI lines are rising quickly, judging by the magnitude of price movement seen on the chart. However, this does not suggest a strong bullish outlook, as overbought conditions may be reached soon. Consequently, this will likely hinder notable price increases in this market.
Dogecoin Price Prediction: DOGE/USDT Eyes Additional Short-Term Gains (4-Hour Chart)
By extending this price analysis to a smaller time frame, it becomes evident that buyers remain active in this market. A new session has begun, and buying activity continues to dominate. As a result, price action is now floating higher above the 20-day and 50-day MA lines.
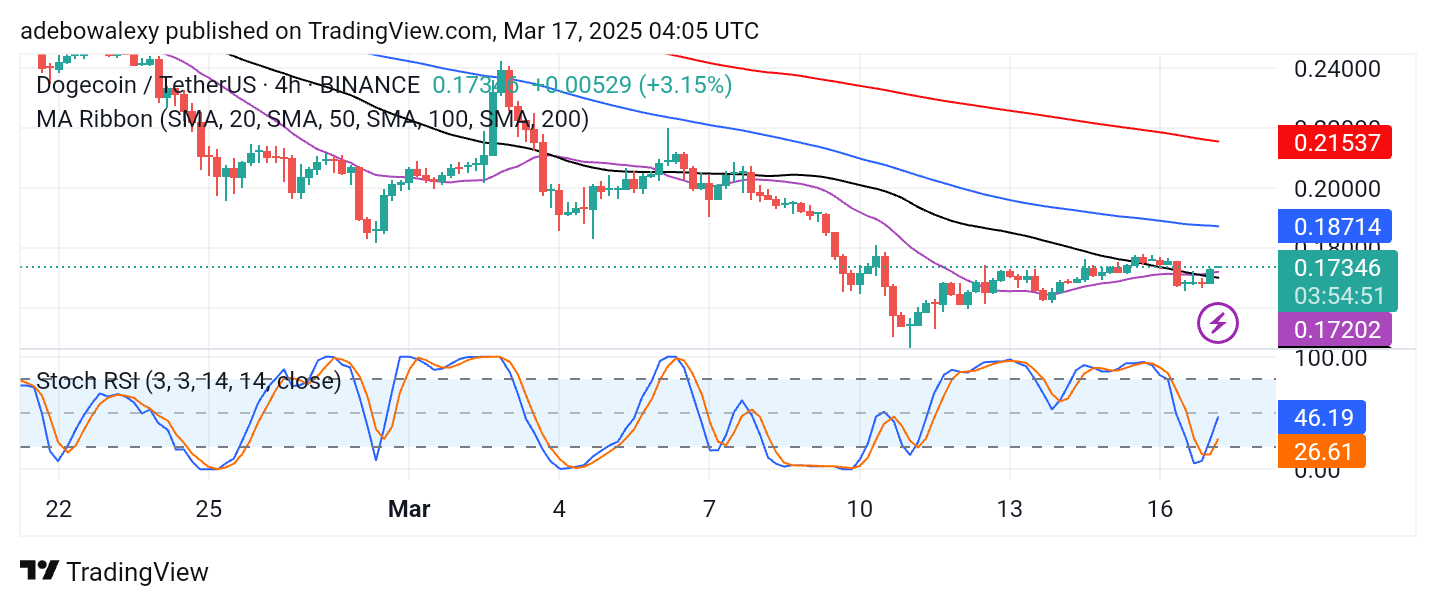
Similarly, the Stochastic RSI indicator lines are projected upwards, following a crossover in the oversold region. Meanwhile, the 100-day and 200-day MA lines remain significantly above price action.
Therefore, it seems this market may only reach short-term targets. As a result, traders in this market may want to maintain their cautious stance, as nearby targets have a higher probability of being achieved. Thus, potential targets lie at the $0.1800 and $0.2000 price levels.