POL (ex-MATIC) Price Prediction: POL/USDT Bears Driven Back at $0.2000 Price Level
Estimated Reading Time: 3 minutes
Don’t invest unless you’re prepared to lose all the money you invest. This is a high-risk investment and you are unlikely to be protected if something goes wrong. Take 2 minutes to learn more

POL (ex-MATIC) Price Prediction: March 15
After testing the support at the $0.2000 price level, price activity in POL (ex-MATIC) has since recovered above that level. However, price action remains under bearish pressure, and the upside retracement may not be very strong.
POL/USDT Long-Term Trend: Bearish (Daily Chart)
Key Price Levels:
Resistance: $0.2500, $0.3000, $0.3500
Support: $0.2000, $0.1800, $0.1500
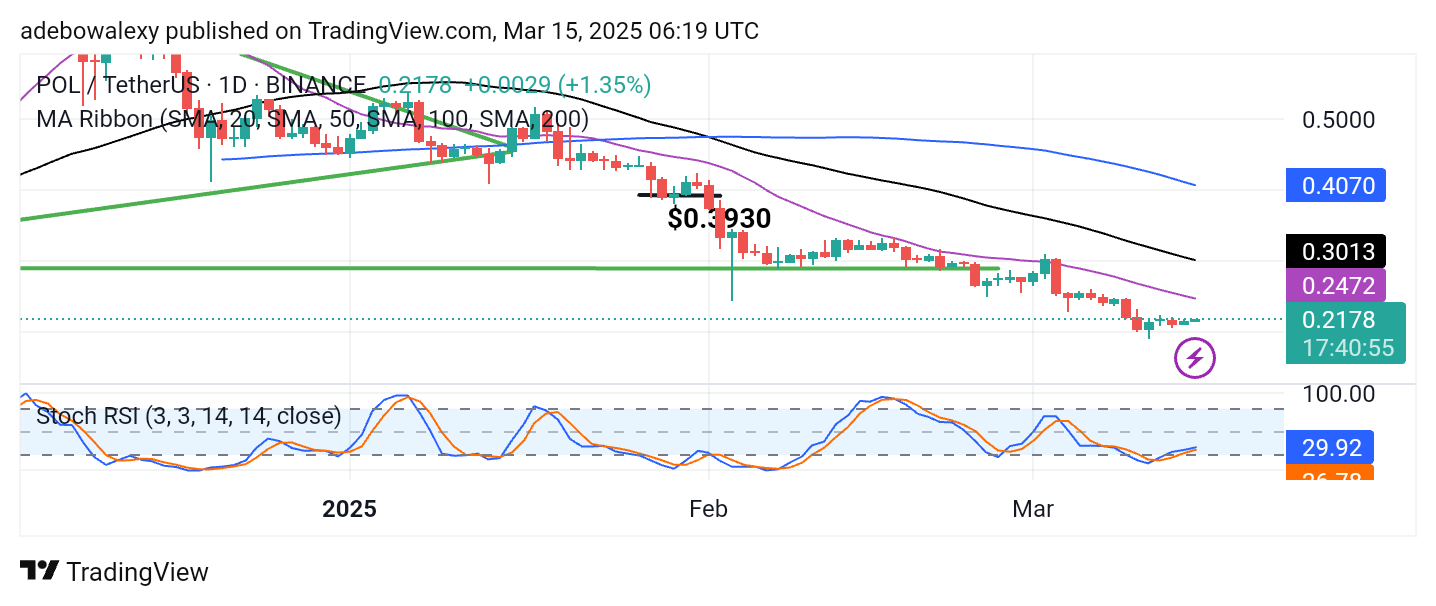
While the price action has recovered above the $0.2000 price level, the POL (ex-MATIC) market has only experienced minimal upside retracement. Consequently, price action remains below all the Moving Average (MA) lines. The latest price candle has a short body and appears below all the MA curves on the chart. Meanwhile, the Stochastic Relative Strength Index (RSI) lines are steadily rising from deep in the oversold region.
POL (ex-MATIC) Price Prediction: POL/USDT Records Only Minimal Gains
Since price activity pulled back above the $0.2000 price level, the market has continued to push against strong headwinds. This is evident in the compressed appearance of the latest price candle on the chart.
Additionally, the fact that price action remains below all the MA lines puts a strain on upside retracements. Despite this, albeit weakly, the Stochastic RSI lines are rising from the oversold region. This aligns with the fact that upside forces are prevailing despite bearish opposition. Nevertheless, traders should watch for favorable fundamental developments that may influence price movement in this market.
POL (ex-MATIC) Price Prediction: POL/USDT Reclines at a Crucial Support (4-Hour Chart)
Price activity in the POL (ex-MATIC) market has risen past the 20-day MA line. For the past six sessions, price action has remained above this technical marker, yet support remains unbreached. The corresponding price candle for the ongoing session remains afloat above the 20-day MA line.
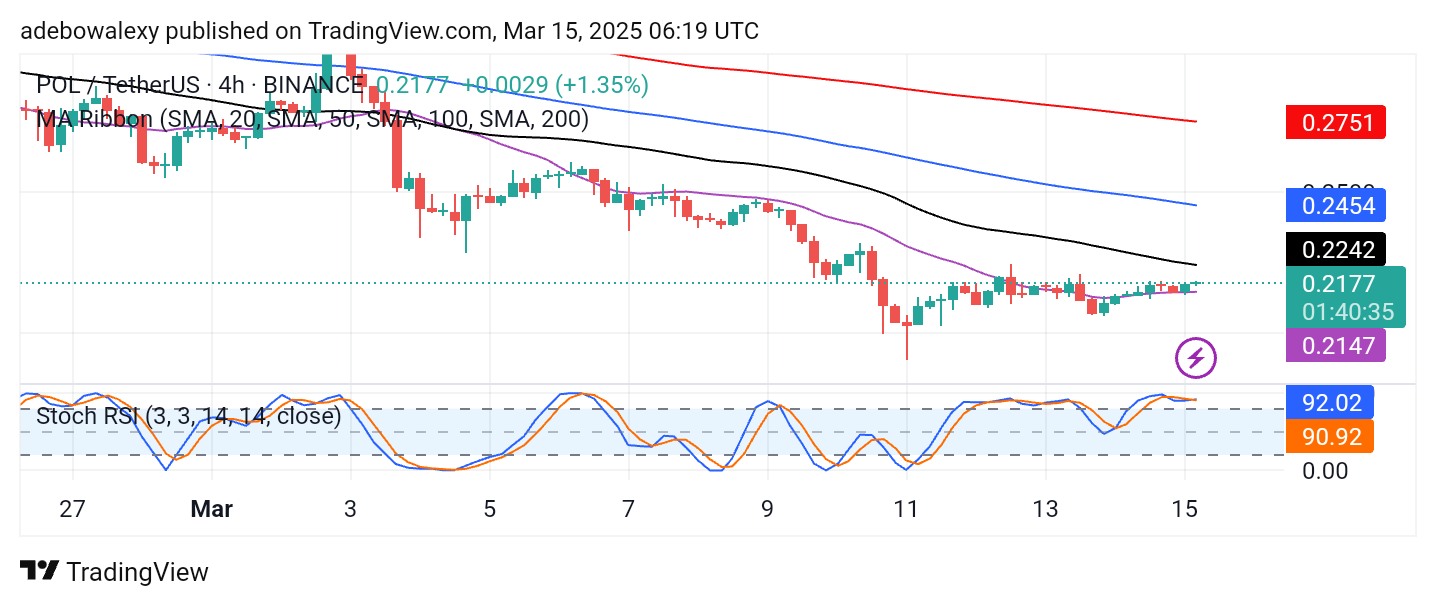
Meanwhile, the Stochastic RSI lines are in the overbought region. Observing the behavior of the Stochastic RSI lines, it appears they are stabilizing in that region of the indicator. Technically, this suggests that buyers may only gather additional short-term gains toward the $0.2400 price level.