Solana (SOL) Price Prediction: SOL/USDT Bears Breach a Four-Month-Old Support
Estimated Reading Time: 3 minutes
Don’t invest unless you’re prepared to lose all the money you invest. This is a high-risk investment and you are unlikely to be protected if something goes wrong. Take 2 minutes to learn more
Solana (SOL) Price Prediction: March 13
Solana has been slowly falling to lower support levels, largely driven by the prevailing bearish sentiment in the market. At the moment, not many coins are making significant profits. Indications from the market suggest that sentiment remains largely bearish.
SOL/USDT Long-Term Trend: Bearish (Daily Chart)
Key Price Levels
Resistance: $125.00, $130.00, $135.00
Support: $120.00, $115.00, $110.00
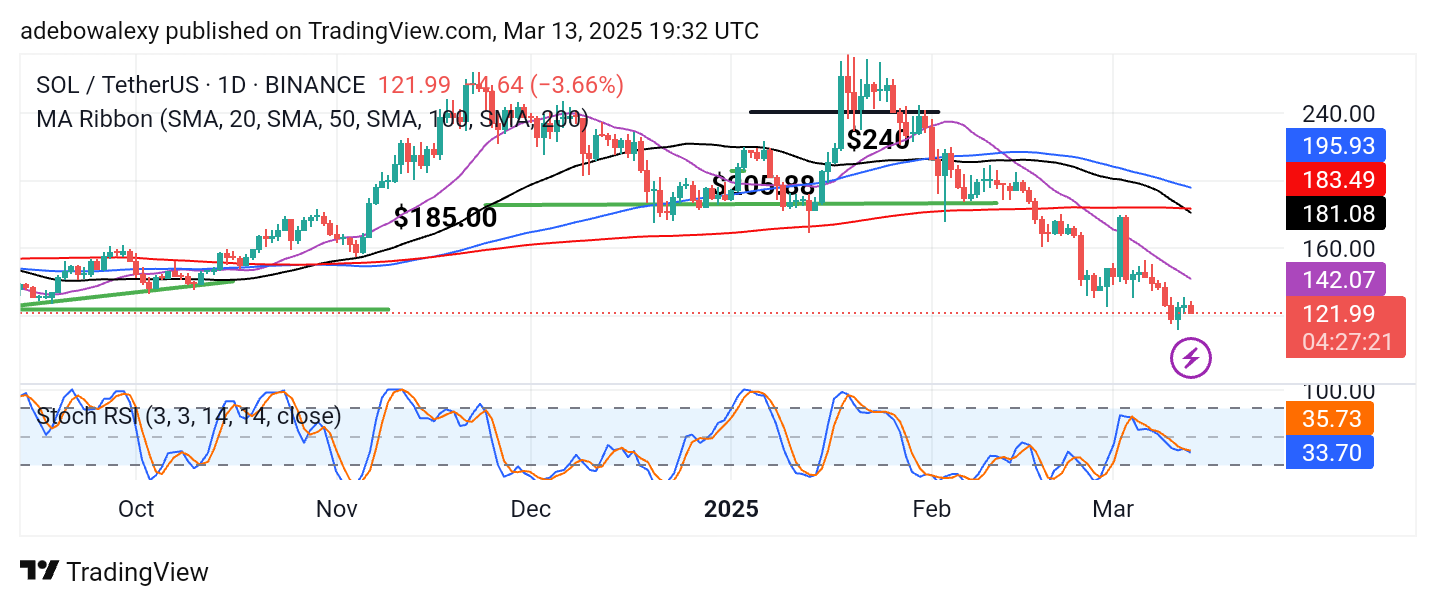
Price activity in the Solana daily chart has seen a minimal upward rebound off the $120 support level. In general, the market has been on a steady downward retracement, moving from one support level to another. The ongoing session has appeared red and is taking place below all the Moving Average (MA) lines. Additionally, the Stochastic RSI lines are proceeding into the oversold region, indicating that downward forces remain dominant.
Solana (SOL) Price Prediction: SOL/USDT May Breach the $120 Baseline
With the way price action is proceeding in the Solana daily market, it appears that prices may fall further south. The ongoing session has registered enough losses to wipe out gains from the previous session and part of the past two sessions.
Also, price activity remains confined below all the MA lines, as price candles have remained below them since mid-February. The Stochastic RSI lines have continued to descend into the oversold region ever since the upside crossover failed. As a result, the market appears strongly bearish and seems headed toward lower price levels.
Solana (SOL) Price Prediction: SOL/USDT Has a Bearish Short-Term Outlook (4-Hour Chart)
Price action in the Solana market has recently hovered around the 20-day MA line. In the ongoing session, the last price candle seems to have just fallen below the 20-day MA curve. As a result, the current price of the token now sits below all the MA lines on the chart.
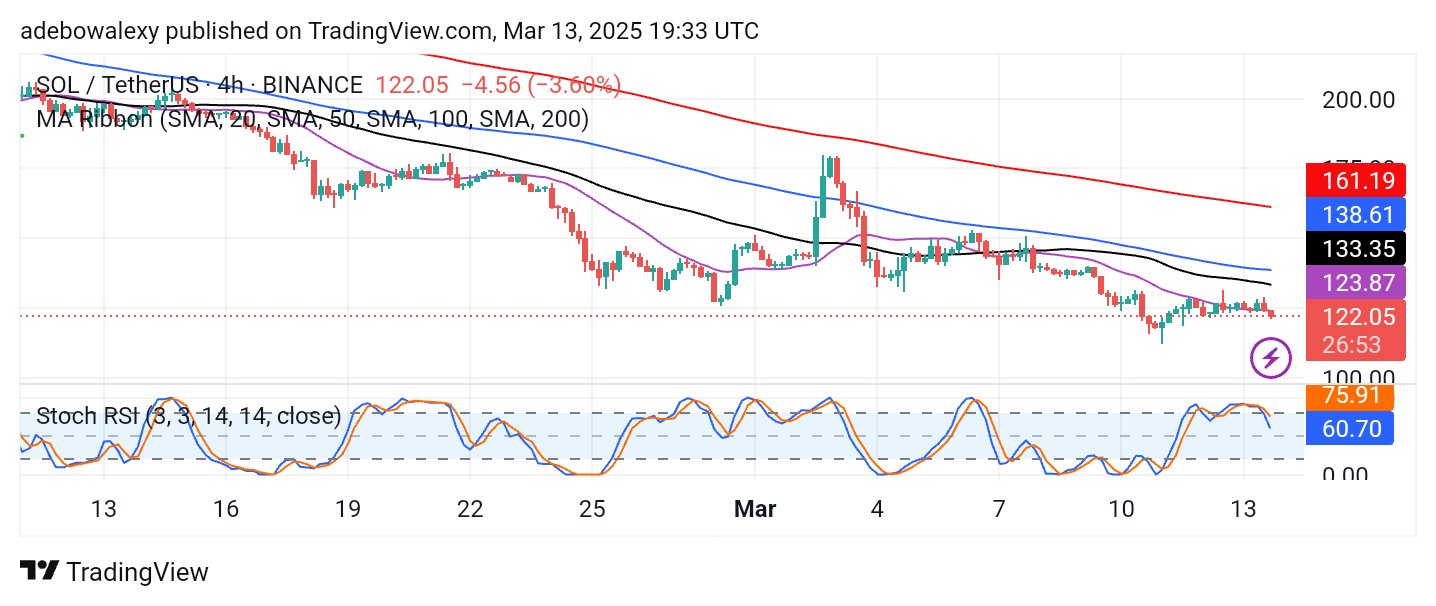
Additionally, the trajectory of the Stochastic RSI lines appears steeper and more divergent downward. Combining this with the fact that price action has just returned below all the MA lines suggests that downward forces are strengthening their hold on price movement. Therefore, it seems logical to anticipate further price retracement below the $120 baseline.