Polygon (MATIC/USD) Market Actions Are in Slow-Moving Paces
Estimated Reading Time: 3 minutes
Don’t invest unless you’re prepared to lose all the money you invest. This is a high-risk investment and you are unlikely to be protected if something goes wrong. Take 2 minutes to learn more
Polygon Price Prediction – May 21
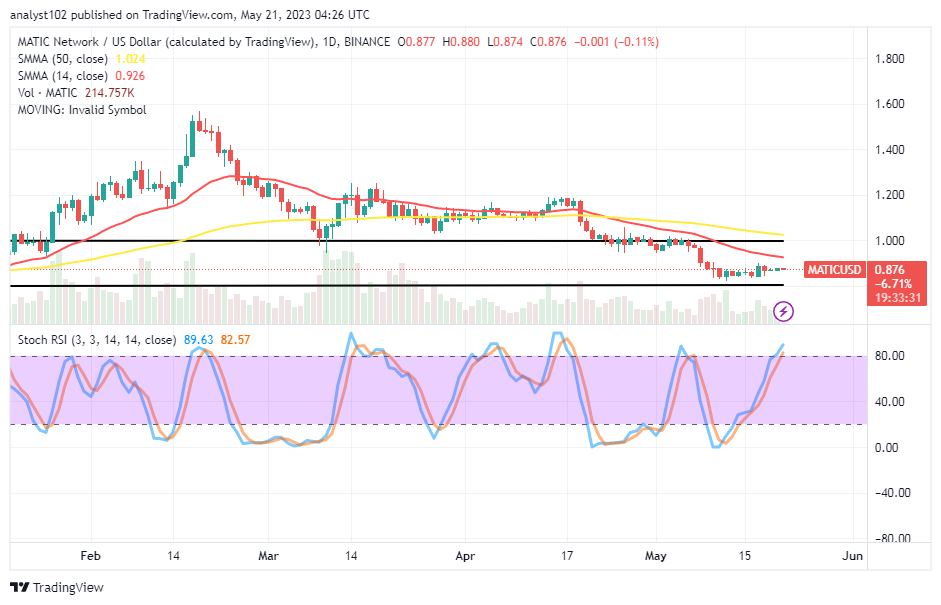
The present psychological trading traits about the MATIC/USD business operations signify that the crypto-economic market actions are in slow-moving paces, causing indecision moments to dominate the featuring. In the meantime, tight-smaller ups and lows in the transactions have been between $0.880 and $0.874 at a minute negative percentage rate of 0.11. The energy to spiral the trend to stable upward motions has reduced considerably.
MATIC/USD Market
Key Levels
Resistance levels: $0.95, $1,05, $1.15
Support levels: $0.80, $0.70, $0.60
MATIC/USD – Daily Chart
The MATIC/USD daily chart t has revealed that crypto-economic market actions are in slow-moving paces with a potency dictation of losing moments underneath or around the trend line of the smaller SMA. The 14-day SMA indicator is below the 50-day SMA indicator. The Stochastic Oscillators have swung northbound, penetrating the overbought region to 82.57 and 87.63 levels. The pushes to the upside are to take some time to manifest.
Should MATIC/USD market participants project placing a sell order at the 14-day SMA’s mark?
Going by the current reading emanating from the indicators, it is likely that the MATIC/USD market partakers to short positions around the positioning of the 14-day SMA’s mark as the crypto market actions are in slow-moving paces. The impulse level to back the possibility of moves to the north side still needs to restart building up the catalysts from or around the baseline at $0.80.
On the decreasing valuation direction of the MATIC/USD trade transaction, it has showcased that a barrier-trading line has laid around the point of the smaller SMA indicator or in an extension of a higher-resistance of the bigger SMA’s point around $1.024 in the long run. All in all, it is vastly approaching that bears are expected to have the upper hand over the crypto business, forcing it to maintain the bearish path it has been on over time.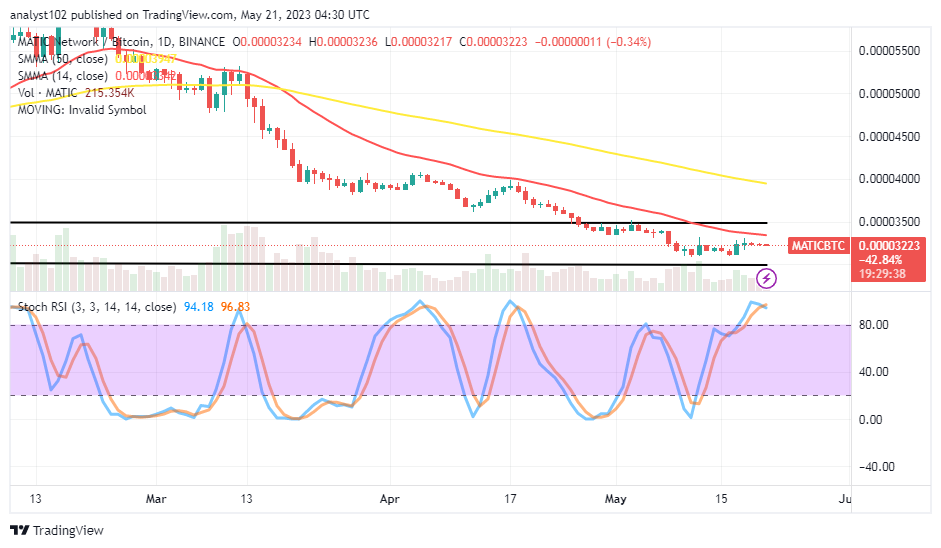
MATIC/BTC Price Analysis
In contrast, Polygon’s trending capacity is presently struggling to regain stances against Bitcoin. The Stochastic Oscillators are, by definition, overbought at 96.83 and 94.18 levels, which shows that the paired crypto market movements are occurring slowly. The 14-day SMA trend line is underneath the 50-day SMA trend line. The upper horizontal line down the psychological level the base crypto has to break out to beef up the breath against the counter-trading cryptocurrency.
Note: Cryptosignals.org is not a financial advisor. Do your research before investing your funds in any financial asset or presented product or event. We are not responsible for your investing results.
You can purchase Lucky Block here. Buy LBLOCK