Polygon (MATIC/USD) Prices Are Forming a Base Near $0.80
Estimated Reading Time: 3 minutes
Don’t invest unless you’re prepared to lose all the money you invest. This is a high-risk investment and you are unlikely to be protected if something goes wrong. Take 2 minutes to learn more
Polygon Price Prediction – May 14
The present financial trading situation of the MATIC/USD market depicts that prices are forming a base near the $0.80 support line. Despite the general prevalence of the declines in the pairing instrument over time, a buying trait has brought about a promising-regaining effort between $0.840 and $0.862 values at an average positive percentage rate of 1.06. Before swinging up again in full, buyers might be taking a break in the capacity buildup above the current trading zone.
MATIC/USD Market
Key Levels
Resistance levels: $0.95, $1,05, $1.15
Support levels: $0.80, $0.70, $0.60
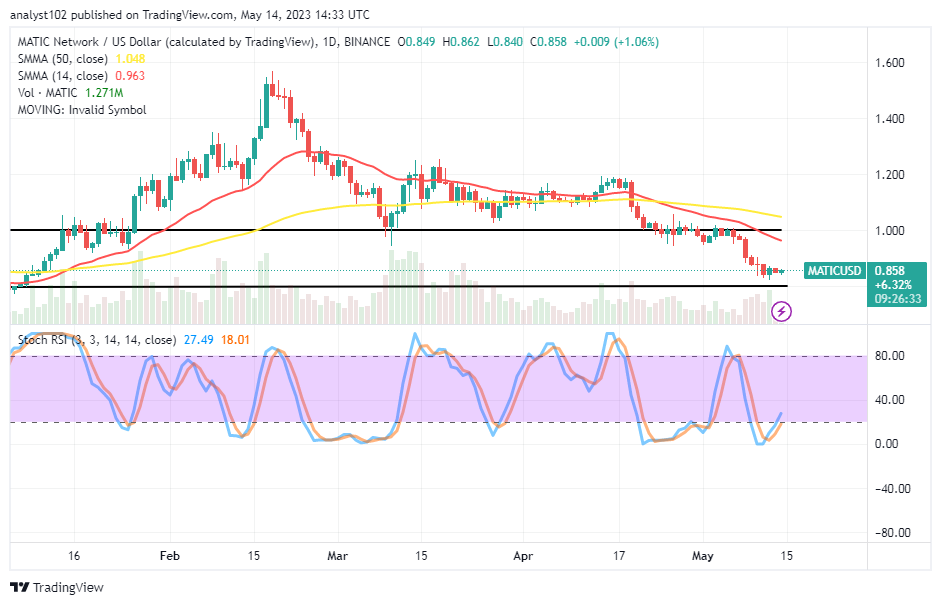
MATIC/USD – Daily Chart
The MATIC/USD daily chart t has revealed that crypto-economic prices are forming a base near the $0.80 support level, where a lower horizontal line drew to make it a beginning point of underlying support lines. The 50-day SMA indicator is below the $0.963 level of the 14-day SMA indicator. With 18.01 and 27.49 points, the stochastic oscillators have been trying to move northward from the oversold area. That demonstrates a positive change in the cryptocurrency’s price movement in a low-force setting.
What circumstance may cause the MATIC/USD market to operate below the $0.80 support region?
Long holding of positions around the MATIC/USD market $0.80 line could also lead to a loss of pushing capacity to the north side, especially if the Stochastic Oscillators are in the overbought condition and will potentially give in to seeing more reductions past the value as the crypto-economic prices are forming a base near it. In the meantime, selling activities around the point in question may suspend.
On the devaluation-moving direction of the MATIC/USD trade technical analysis, short-position placers should consider the use of price action to back their entries after allowing a situation whereby a trading candlestick forms toward or around the 14-day SMA before taking actions in line with the principle of proper money management. That presumption will possibly take time before coming to pass.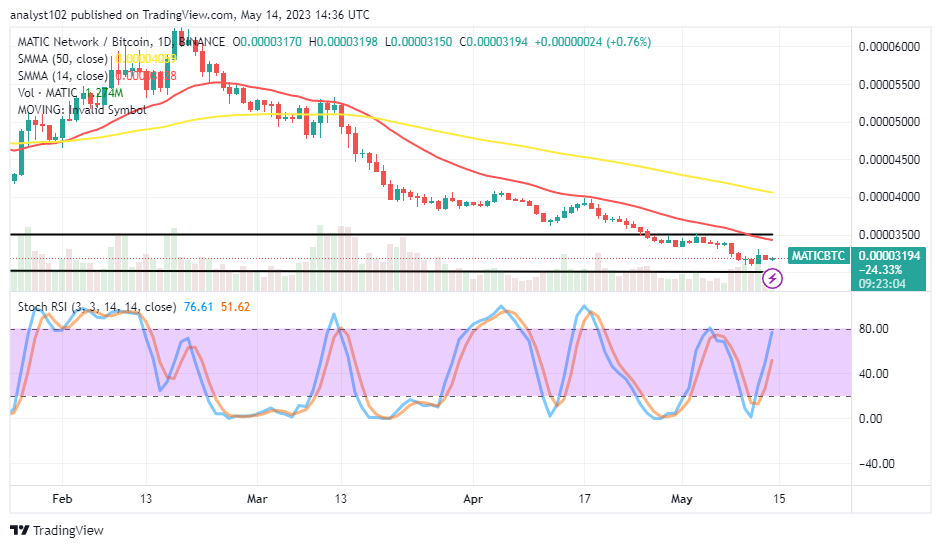
MATIC/BTC Price Analysis
In contrast, Polygon appears to be vastly losing the catalyst systemically against Bitcoin as the trading candlesticks show prices are forming a base near the lower horizontal line drawn. The 14-day SMA trend line is underneath the 50-day SMA trend line. The Stochastic Oscillators have traveled northbound from the oversold region to 51.62 and 76.61 levels. However, the candlesticks’ formation pattern shows the base cryptocurrency isn’t ready to recover against its counter-trading cryptocurrency.
Note: Cryptosignals.org is not a financial advisor. Do your research before investing your funds in any financial asset or presented product or event. We are not responsible for your investing results.
You can purchase Lucky Block here. Buy LBLOCK