Bitcoin (BTC) Price Prediction: BTC/USDT Eyes the $95,000 Mark
Estimated Reading Time: 3 minutes
Don’t invest unless you’re prepared to lose all the money you invest. This is a high-risk investment and you are unlikely to be protected if something goes wrong. Take 2 minutes to learn more

Bitcoin (BTC) Price Prediction: April 23, 2025
The Bitcoin market has recently shown signs of revival, with prices beginning to resurface above previous resistance levels one after another. A more detailed analysis of the market is provided below.
BTC/USDT Long-Term Trend: Bullish (Daily Chart)
Key Price Levels:
Resistance: $95,000, $100,000, $105,000
Support: $90,000, $85,000, $80,000
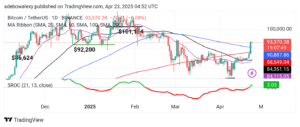
Trading activity in the Bitcoin daily market has moved above all the Moving Average (MA) lines on the token’s daily chart. Although the latest price candle is red, it appears significantly above all the MA lines. The candle is small, which is why the Stochastic Rate of Change (SROC) indicator has not yet reflected this movement. As a result, the SROC line continues to rise steadily and remains above the equilibrium level.
Bitcoin (BTC) Price Prediction: BTC/USDT Market Set to Record More Price Increases
Price action in the Bitcoin daily market has climbed above all MA lines after spending a significant amount of time below these key levels. Currently, price action remains above important technical thresholds. The past two sessions have been particularly notable, with prices rising strongly.
However, the current session, as of the time of writing, has shown only minimal gains. Nevertheless, the market remains above all the MA lines. Meanwhile, the 20- and 50-day MA curves appear to be converging below the price action, which suggests the potential for further upward movement. Additionally, the SROC indicator continues to rise above the 0.00 mark. Considering all available indicators, it seems likely that BTC may appreciate further shortly.
Bitcoin (BTC) Price Prediction: BTC/USDT Poised to Push Higher
On the 4-hour chart, the Bitcoin market appears set to continue its upward trajectory. The latest price candle is green, following a red candle, indicating renewed buying interest.
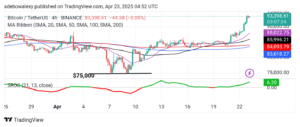
Furthermore, price action remains above all the MA lines, consistent with the daily chart’s performance. The SROC line pushes upward after a smooth rebound off the equilibrium level. Overall, the market seems to be on a clear path toward testing the $95,000 price level.