$SPONGE (SPONGE/USD) Faces Major Resistance at $0.00004
Estimated Reading Time: 2 minutes
Don’t invest unless you’re prepared to lose all the money you invest. This is a high-risk investment and you are unlikely to be protected if something goes wrong. Take 2 minutes to learn more

The recent climb in the SPONGE/USD market above the $0.0000367 level is a strong signal that the bulls might be gaining the upper hand. Previously, the market showed subtle bearish tendencies, with resistance levels slowly declining despite the bulls’ efforts. However, the recent push above $0.0000367 indicates a potential shift towards an upward trend. The next significant hurdle is the $0.00004 resistance level. If the market successfully breaks through this barrier, it could spark increased bullish activity, presenting an opportunity for investors to take advantage of this potential shift.
Key Market Dynamics:
- Resistance Levels: $0.0010, $0.0011, $0.0012
- Support Levels: $0.000026, $0.000025, $0.000024
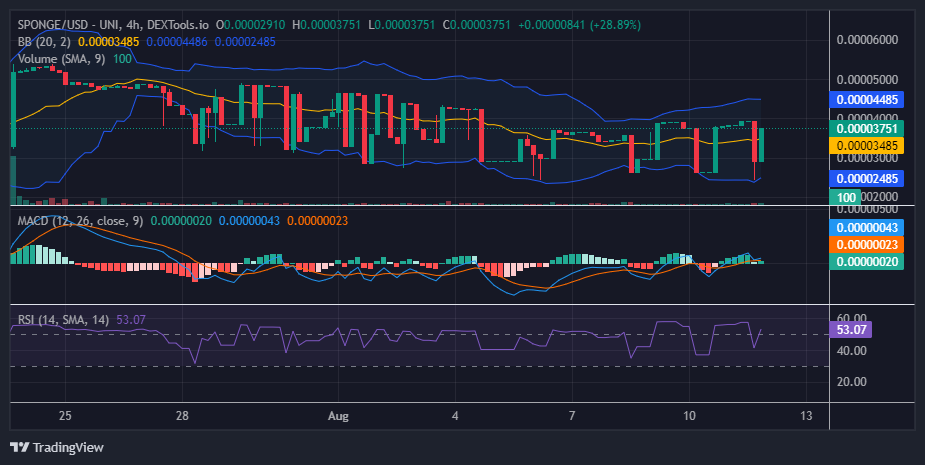
$SPONGE (SPONGE/USD) Technical Analysis
The bulls have shown their dominance during the current 4-hour trading session, as evidenced by the formation of a marubozu candlestick. This pattern suggests that the bullish momentum is still strong, targeting the $0.00004 price level. Although this level previously had bullish support, it has recently come under pressure from bearish forces. Nevertheless, a strong bullish presence at the $0.000026 support level remains intact. Holding this support could set the stage for a potential breakout above the critical $0.00004 resistance.
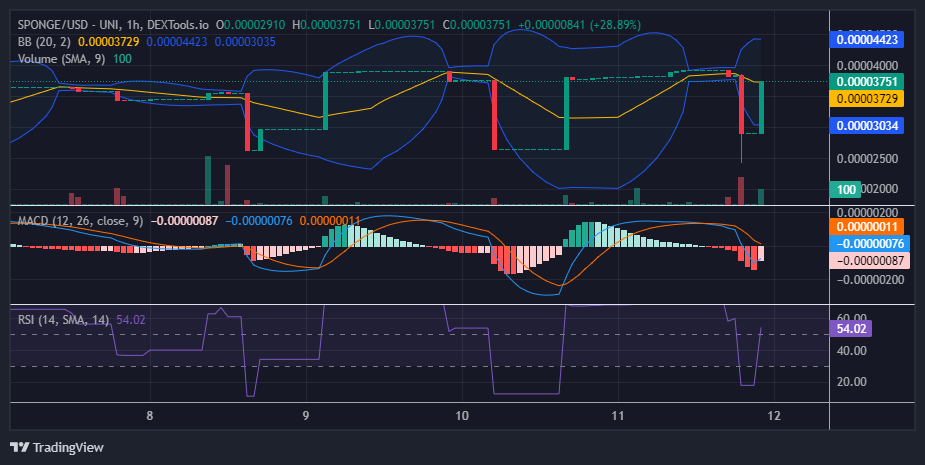
$SPONGE 1-Hour Chart Overview
On the 1-hour chart, $SPONGE is currently in a consolidation phase, with prices fluctuating within a defined range, showing no clear trend. This could indicate a period of accumulation, potentially leading to a significant price movement. The frequent appearance of marubozu candlesticks on the chart supports this possibility. This phase might represent either an accumulation by buyers or a distribution by sellers, building momentum for a potential breakout. The overall market behavior suggests a buildup phase that could be followed by a breakout, where the latter typically occurs after the former.
Buy $SPONGE!
Where the damp at? 💦 pic.twitter.com/KClTbufmqI
— $SPONGE (@spongeoneth) August 7, 2024
Join the SPONGE community and be part of the next big crypto sensation! Buy Sponge ($SPONGE) today!