$SPONGE (SPONGE/USD) Confronts Key Resistance at $0.00004
Estimated Reading Time: 3 minutes
Don’t invest unless you’re prepared to lose all the money you invest. This is a high-risk investment and you are unlikely to be protected if something goes wrong. Take 2 minutes to learn more

The recent surge in the $SPONGE market above the $0.0000367 price level is a promising indication of a potential shift in favor of the bulls. Previously, the market exhibited a subtle bearish trend, as resistance levels gradually moved downward despite the resilience of the bulls. However, the recent breakout above $0.0000367 suggests that the market may be poised for an upward trend. The next critical test lies at the $0.00004 resistance level. A successful breakout at this point could trigger increased bullish momentum, so investors should be prepared to capitalize on this potential shift.
Key Market Dynamics:
- Resistance Levels: $0.0010, $0.0011, and $0.0012
- Support Levels: $0.000026, $0.000025, and $0.000024
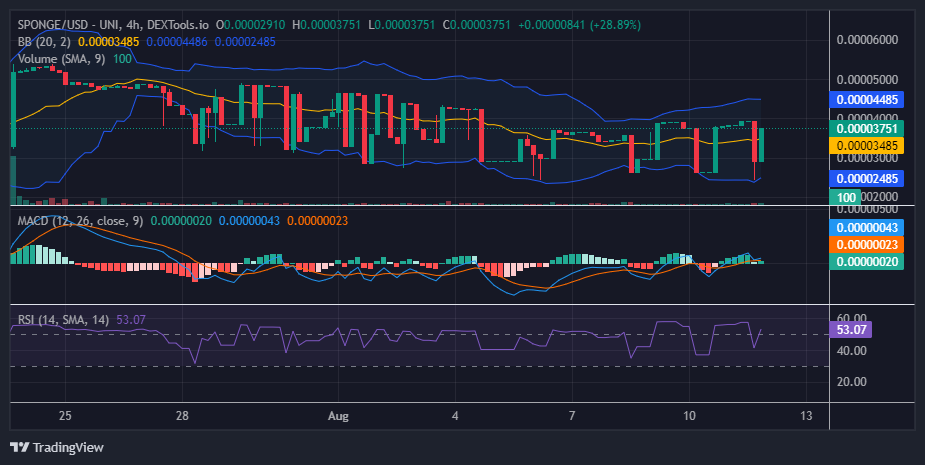
$SPONGE (SPONGE/USD) Technical Outlook
The bulls have demonstrated their strength by fully dominating the current 4-hour trading session. This crypto signal is evidenced by the formation of a marubozu candlestick, which indicates that the bullish trend is still active, targeting the $0.00004 price level. Although this level was previously supported by bullish sentiment, it has recently succumbed to bearish pressure. Despite this, there remains a strong bullish presence at the $0.000026 level. Maintaining this position could pave the way for a potential breakout above the critical $0.00004 resistance.
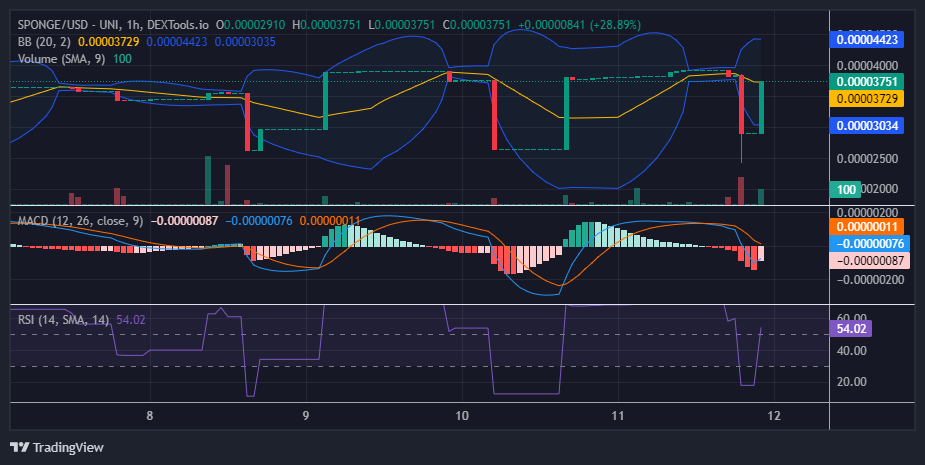
$SPONGE (SPONGE/USD) 1-Hour Chart Insights
The 1-hour chart for the $SPONGE market indicates a consolidating phase, with the price moving within a defined range and lacking a clear trend. However, this pattern may also suggest the potential for accumulation, which could lead to a strong price movement. The frequent appearance of marubozu candlesticks on the chart reflects this possibility. This phase could represent either an accumulation period for buyers or a distribution phase by sellers, building up momentum for a potential breakout. The overall market behavior suggests a buildup phase followed by a breakout, where the latter typically occurs after the former.
Buy SPONGE/USD!
That $PEPE damp hits different 💦 pic.twitter.com/2NMZqBTDiD
— $SPONGE (@spongeoneth) August 11, 2024
Join the SPONGE community and be part of the next big crypto sensation! Buy Sponge ($SPONGE) today!