Bitcoin (BTC/USD) Market Remains Below $17,500
Estimated Reading Time: 3 minutes
Don’t invest unless you’re prepared to lose all the money you invest. This is a high-risk investment and you are unlikely to be protected if something goes wrong. Take 2 minutes to learn more
Bitcoin Price Prediction – November 24
Despite the fact that the BTC/USD trade bulls are striving against the recent declining nature poised by bears, the crypto market remains below the $17,500 transaction line over several days of bargaining until the present. Price has been trading zone of $16,589.67 at a minute average rate of 0.02 negative.
BTC/USD Market
Key Levels:
Resistance levels: $17,500, $19,500, $21,500
Support levels: $15,000, $12,500, $10,000
BTC/USD – Daily Chart
The BTC/USD daily chart showcases the crypto-economic market remains below the $17,500 resistance level even though there have been efforts that buyers are trying to swing against further drops from the $15,000 support level. The 14-day SMA indicator has been found closely around the resistance point at $17,632.17, underneath the $19,804.73 of the 50-day SMA indicator. The Stochastic Oscillators have penetrated the overbought region at 75.74 and 95.12 levels.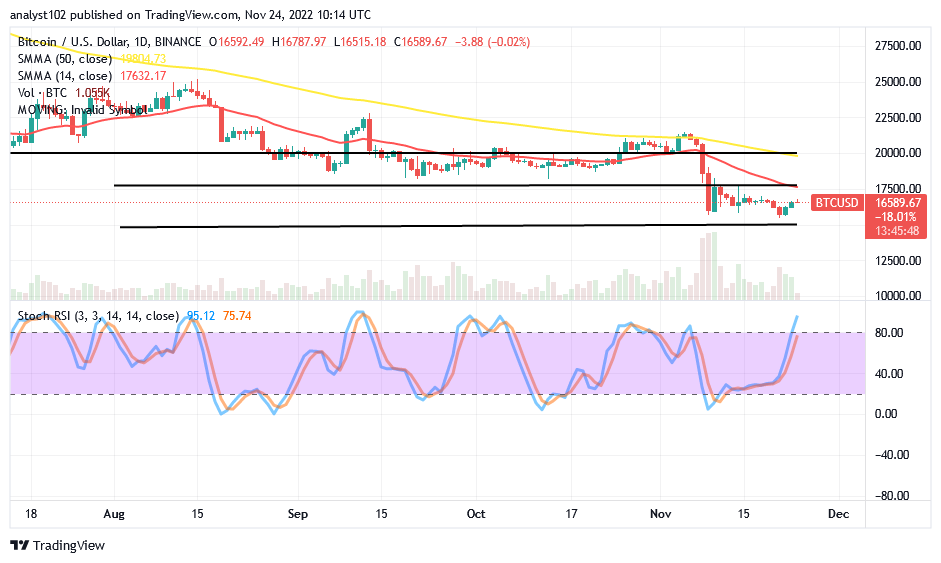
When a breakout happens at $17,500, will it be technically optimal for traders to pursue an uptrend?
Long-position placers may find it technically inclined at an early stage of the BTC/USD market resistance point at the $17,500 level when a fearful breakout happens at any time. A quick reversal during a volatile move around that point and against the 14-day SMA to the downside will invalidate getting sustainable points afterward in the process. Bulls will still need some time to regain their strength before pushing past the value line.
The downside of the BTC/USD technical analysis bears seems to be getting ready to place the market trading condition under another round of declining motions if the price lacks the catalyst to move up against the resistance of the smaller SMA’s value, as indicated in one of the above analytics paragraphs. In the meantime, the points between the $17,500 and $20,000 resistance levels will purposely let sellers get a decent shorting order afterward.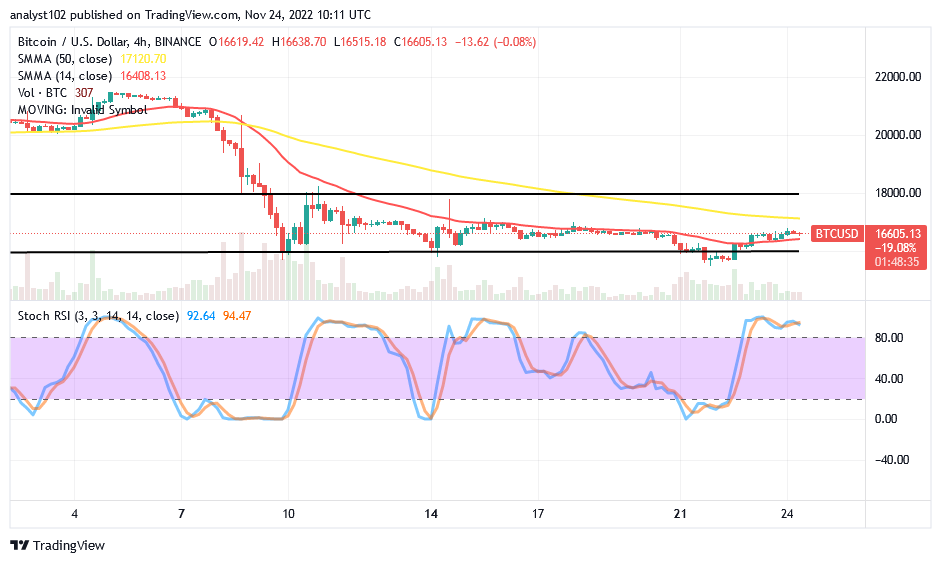
BTC/USD 4-hour Chart
The BTC/USD medium-term chart depicts that the crypto market remains below the bigger SMA trend line. The 14-day SMA indicator is $16,408.13, underneath the $17,120.70 point of the 50-day SMA indicator. The Stochastic Oscillators are in the overbought region, keeping the levels of 94.47 and 92.64 gradually to the south side. That signals a warning that the cryptocurrency is at risk of losing value compared to the US Dollar.
Note: Cryptosignals.org is not a financial advisor. Do your research before investing your funds in any financial asset or presented product or event. We are not responsible for your investing results.
You can purchase Lucky Block here. Buy LBLOCK