Litecoin (LTC/USD) Trade Activities Are in a Bullish Format
Estimated Reading Time: 3 minutes
Don’t invest unless you’re prepared to lose all the money you invest. This is a high-risk investment and you are unlikely to be protected if something goes wrong. Take 2 minutes to learn more
Litecoin Price Prediction – April 18
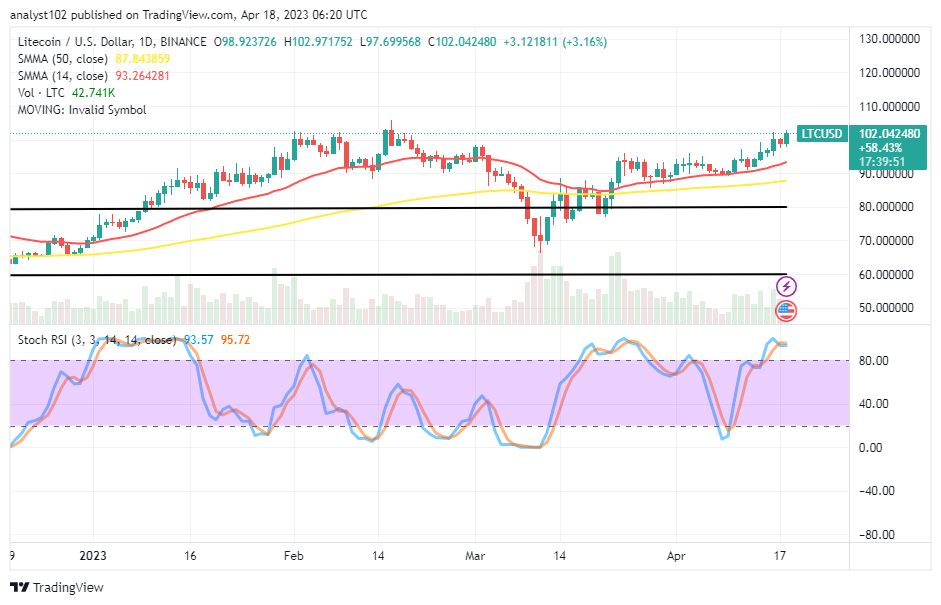
An overbought-trading condition has come to play out in a consolidation manner as the LTC/USD trade activities are in a bullish format. The current bargaining session is between the confiment value points of $102.971752 and $97.699568 at a percentage rate of 3.16 positives. It would only take an intensifying efforts on the part of buyers to break through an overhead barrier-trading lines.
LTC/USD Market
Key Levels:
Resistance levels: $110, $115, $120
Support levels: $90, $85, $80
LTC/USD – Daily Chart
The LTC/USD daily chart reveals the crypto-economic trade activities are in a bullish format, taking place over the buy signal side of the SMA trend lines. The 14-day SMA indicator is slowly trending higher at a pace of $93.264281 above the $87.843859 value line of the 50-day SMA indicator. The Stochastic Oscillators are in the overbought region at the levels of 93.57 and 95.72, indicating the potential of the market can either run in a pause or a slight-moving style.
Can there be more ups in the LTC/USD market in a continuation of the present upward move?
There can be more ups in the LTC/USD market if long-position takers do not reverse their trend to the manner of forming a convergence as the crypto-economic trade activities are in a bullish format. On the contrary to that notion, resistance above may not be forthcoming easily in this running setting.
On the downside of the technical analysis, short-position takers will have to take note of a rejection signal when the 1-hour and 4-hour charts complement the stance of a bearish resumption before exerting a shorting order. A push toward the resistance line at $110 for testing will possibly allow a necessary correction to give way to a sell position order.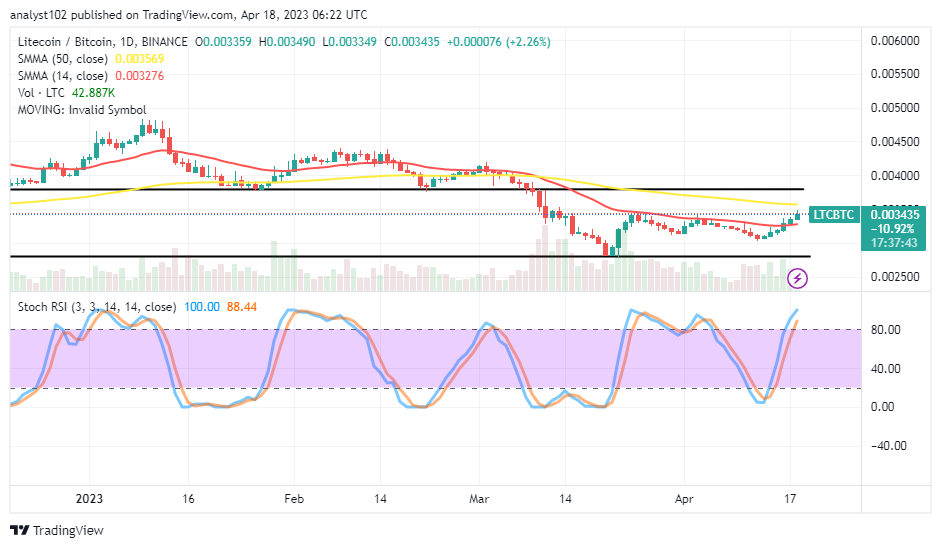
LTC/BTC Price Analysis
In contrast, Litecoin is stronger than Bitcoin in the definite range-bound zones. The pairing crypto trade activities are in a bullish outlook, averaging the bigger SMA. The 14-day SMA indicator is underneath the 50-day SMA indicator. Ochastic Oscillators are in the overbought region at 88.44 and 100 levels. The buying spree has no dropping sign now despite the present extreme condition in the upside direction.
Note: Cryptosignals.org is not a financial advisor. Do your research before investing your funds in any financial asset or presented product or event. We are not responsible for your investing results.
You can purchase Lucky Block here. Buy LBLOCK