Litecoin (LTC/USD) Market Is on the Rise
Estimated Reading Time: 3 minutes
Don’t invest unless you’re prepared to lose all the money you invest. This is a high-risk investment and you are unlikely to be protected if something goes wrong. Take 2 minutes to learn more
Litecoin Price Prediction – April 11
Presently, observation showcases the LTC/USD market is on the rise against the last short-range trending posture it possessed recently. The positivity sign on the percentage rate of the business bargaining is at 1.88, maintaining the activities between $93.106454 and $97.071597 points over the last fewer hours of today. There are signs that the price could increase to $100 and then $110.
LTC/USD Market
Key Levels:
Resistance levels: $100, $110, $120
Support levels: $85, $80, $75
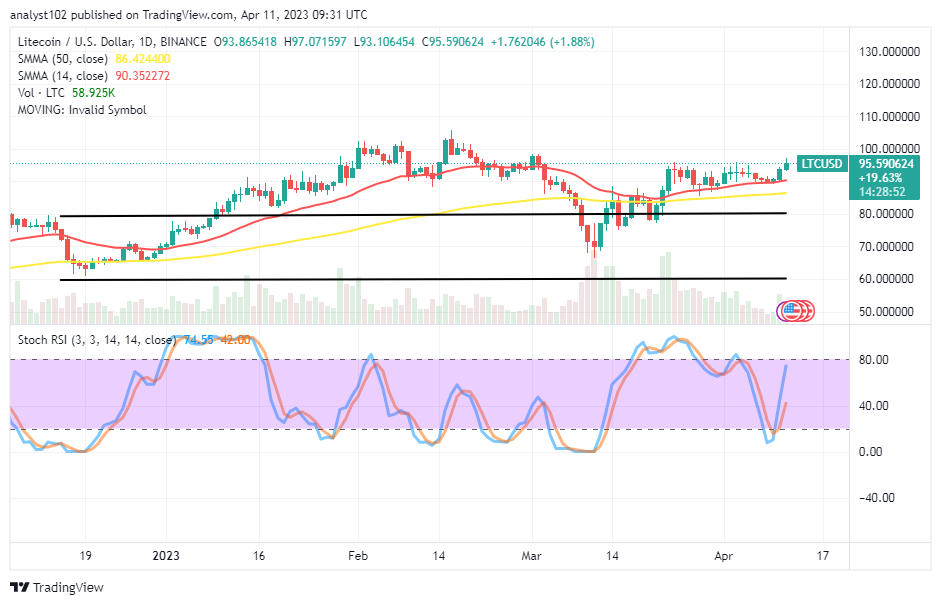
LTC/USD – Daily Chart
The LTC/USD daily chart depicts the crypto-economic market is on the rise that could break through some resistances, intensifying more efforts over the buy signal side of the SMAs. The 50-day SMA indicator is at $86.424400, while the 14-day SMA indication is at $90.352272, which is higher. The Stochastic Oscillators have crossed against the 80 levels through a northward direction from the area that is oversold to 42.00 and 74.55, indicating that some uprisings are in the spotlight.
Will the price of LTC/USD suddenly rise off the ground without seeing a close pullback soon?
Carefulness must exercise if a sudden bounce-off plays alongside the current trading capacity in the LTC/USD trade operations, as the crypto market has been on the rise over its SMA trend lines. An aggressive force in the increase will likely witness a retracement process around the resistance line of $120 in the long run.
On the downside of the technical analysis, the LTC/USD trade sellers may now have to be on the lookout for an overbought reading state partnering with the emergence of a bearish-trading candlestick to signify the potency of the beginning of bulls losing their energy to move up more afterward before execution of shorting orders. Nonetheless, there is now little need for long-term investors to be alarmed about the higher anticipated resistance zone.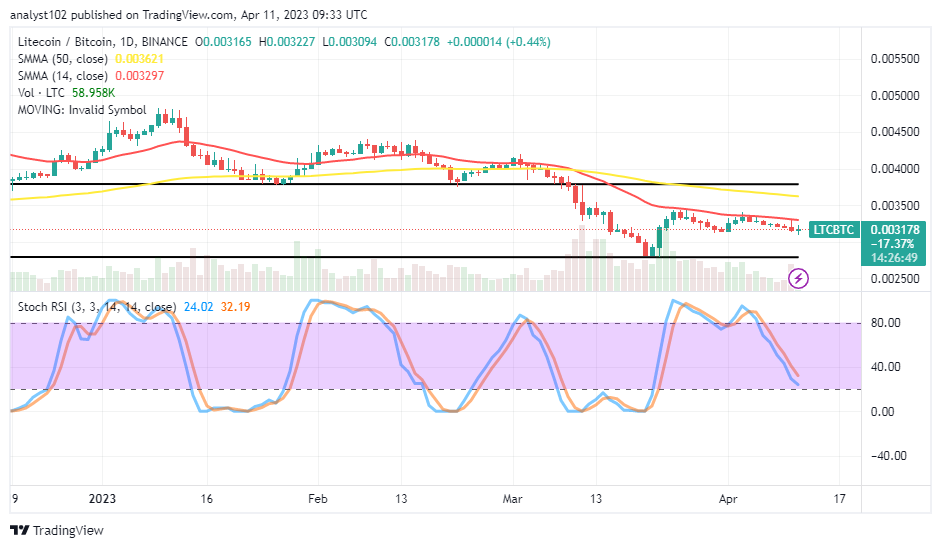
LTC/BTC Price Analysis
Litecoin’s trending outlook, in contrast with Bitcoin, possesses a smaller series of bearish candlesticks to showcase that it is still relatively under a falling force at the lower-trading zone. The cryptocurrency pair market could change to be on the rise if the 14-day SMA indicator breaches northward toward the trend line of the 50-day SMA, which is at the top. The Stochastic Oscillators have been in a slant-moving mode southbound to 32.19 and 24.02 levels. That suggests the base cryptocurrency may still need some time to establish a baseline versus its counter-trading cryptocurrency.
Note: Cryptosignals.org is not a financial advisor. Do your research before investing your funds in any financial asset or presented product or event. We are not responsible for your investing results.
You can purchase Lucky Block here. Buy LBLOCK