Litecoin (LTC/USD) Price Is Running in a Recession Session
Estimated Reading Time: 3 minutes
Don’t invest unless you’re prepared to lose all the money you invest. This is a high-risk investment and you are unlikely to be protected if something goes wrong. Take 2 minutes to learn more
Litecoin Price Prediction – April 4
A current observation is that the LTC/USD market’s price has been running in a recession session tightly below the $95 resistance line over some days. Most of the motions have been relatively carrying declining signs as the crypto economy trades around $92.624094 at a minute average rate of 0.38 negative. The overriding verdict is that buying moments have reached a peak point.
LTC/USD Market
Key Levels:
Resistance levels: $100, $105, $110
Support levels: $80, $75, $70
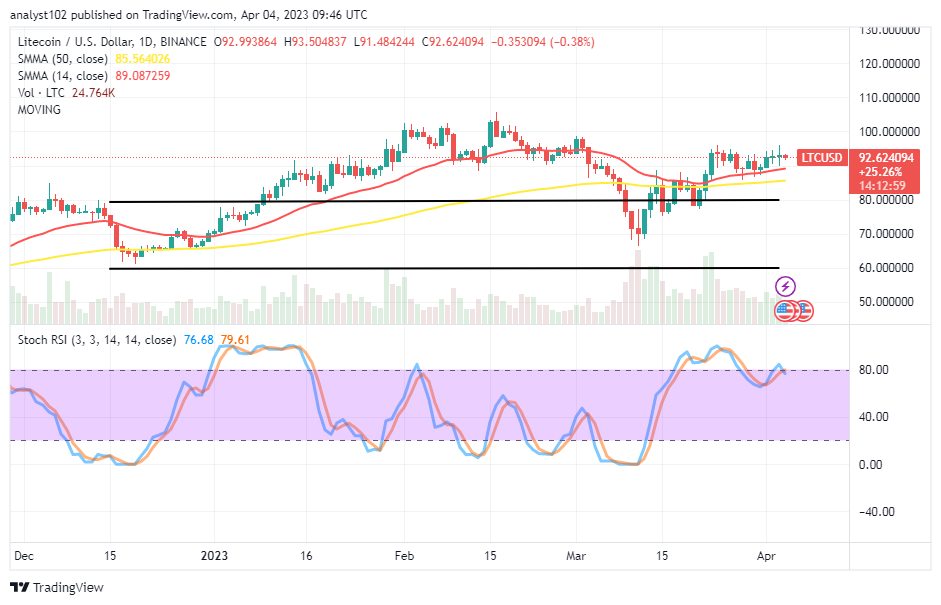
LTC/USD – Daily Chart
The LTC/USD price is running in a recession session, as showcased on today’s daily chart. During this technical analytics, the 14-day SMA trend line is at $89.087259 over the $85.564026 value line of the 50-day SMA trend line. The upper range line remains drawn at the $80 support point, serving as the crucial zone against any aggressive move to the downside in no time. The Stochastic Oscillators are around 79.61 and 76.68, slightly indicating a decline is imminent.
What are the likely more challenging aspects of the LTC/USD trading following the $95?
LTC/USD market operation will likely encounter more challenging aspects of an upsurge should past the $95 barrier-trading zone be $100 resistance as the crypto’s price is running in a recession session. Bulls should suspend their actions of making a come-back, especially as there has been a lesser-active sign that the Stochastic Oscillators will portend a significant loss of trading capacity.
On the downside of the technical analysis, the LTC/USD market bears may have to extend their shorting entries between the $95 and $100 resistance values. An instant execution of a shorting order could be okay when a rejection around or underneath those points is spotted afterward. Sellers will be vigilant when carrying out that assumed task that can come to play suddenly.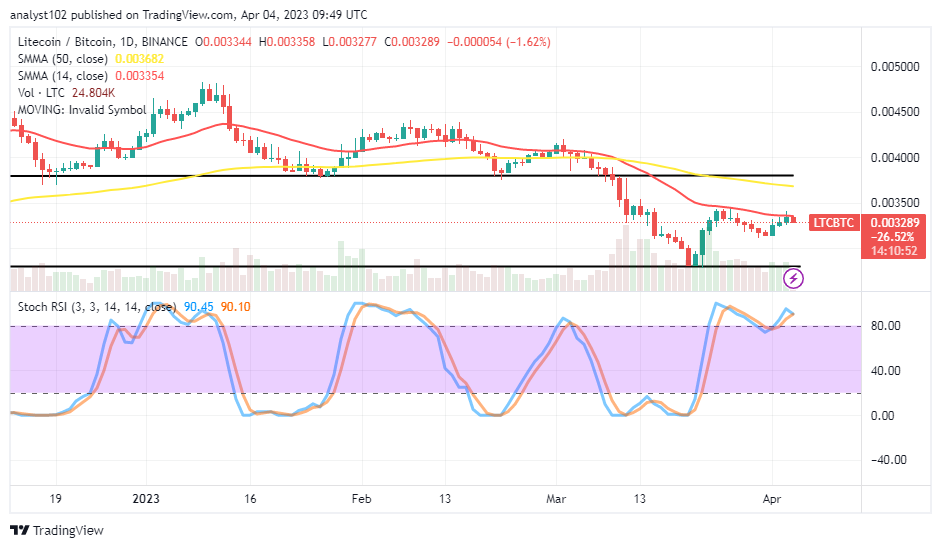
LTC/BTC Price Analysis
Litecoin’s trending outlook, in contrast with Bitcoin, has remained under a depression pattern below the SMA trend lines. The 14-day SMA indicator is underneath the 50-day SMA indicator. The Stochastic Oscillators are in the overbought region, maintaining 90.10 and 90.45 levels. A smaller-southbound-trending candlestick is in the making, making the Oscillators attempt crossing to the downside on a lighter mode. The base cryptocurrency doesn’t seem to conjure the strength to push against the counter cryptocurrency anytime soon.
Note: Cryptosignals.org is not a financial advisor. Do your research before investing your funds in any financial asset or presented product or event. We are not responsible for your investing results.
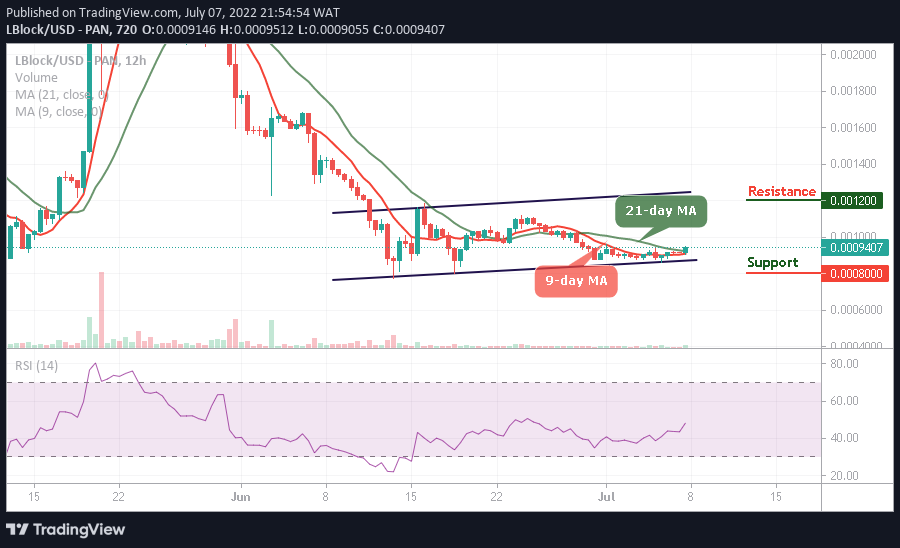
You can purchase Lucky Block here. Buy LBLOCK