Litecoin (LTC/USD) Market Is Transitioning to a Regression
Estimated Reading Time: 3 minutes
Don’t invest unless you’re prepared to lose all the money you invest. This is a high-risk investment and you are unlikely to be protected if something goes wrong. Take 2 minutes to learn more
Litecoin Price Prediction – March 28
A condition has emanated to signify a slow reduction in the valuation of the LTC/USD as the crypto market is transitioning to a regression mode in the aftermath failure of bulls to push beyond a barrier of around the $95 line in the recent operations. At a 2.66 percentage rate of negativities, the US Dollar has outpaced the crypto economy from a high point of $89.527402 down to $86.889917. Yet, the market can go somewhat further down in a slow-moving manner.
LTC/USD Market
Key Levels:
Resistance levels: $95, $100, $105
Support levels: $80, $75, $70
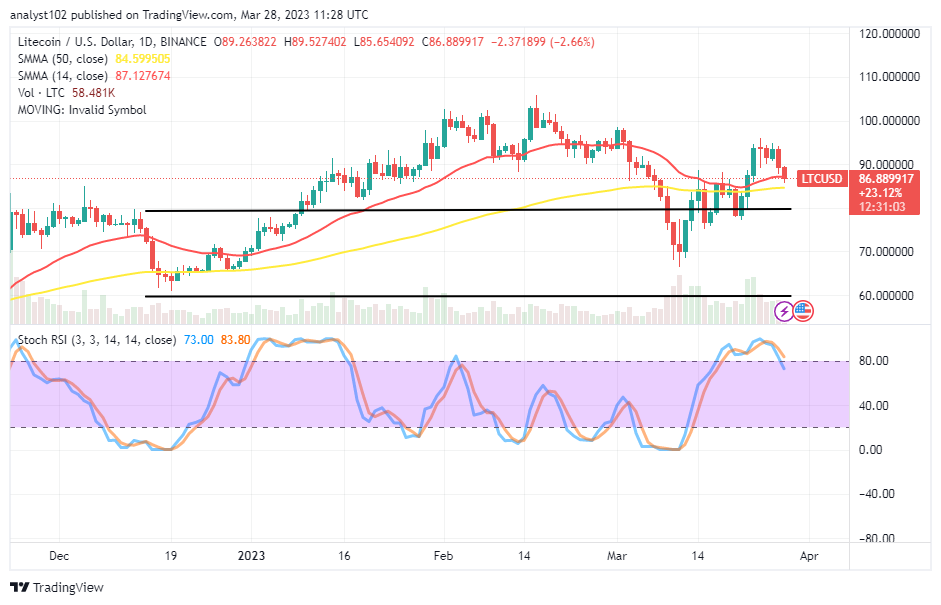
LTC/USD – Daily Chart
The crypto market is transitioning to a regression cycle from the $95 barrier level, according to the LTC/USD daily chart. The 14-day SMA trading indicator is at $87.127674 above the $84.599505 value line of the 50-day SMA indicator. The Stochastic Oscillators have crossed southbound from the overbought region to 83.80 and 73.00 levels to showcase the capacity exhausted to the downside.
Will a reversal move against the bearish candlestick suffice the LTC/USD bulls’ runs after $95?
The LTC/USD market is moving into a regression as the current negative trading candlestick doesn’t seem to be seeing a bounce back upward. Buyers need to be cautious in exercising a longing position order until bullish candlestick surfaces. A buy limit order can be set closely over the $75 support level for a few days. It does not need to be on a long-term running basis if it is on a platform like MT4 or another similar trading platform.
On the downside of the technical analysis, the LTC/USD market short-position takers may ride on the current falling moves, provided there won’t soon be a rebound alongside. The psychological impact of the resistance level at $95 will be crucial in determining whether getting good shorting entry for sellers is eliminated.
LTC/BTC Price Analysis
As a result of coupling with the valuation of Bitcoin from the sell signal side of the smaller SMA, Litecoin appears to be starting a transition to a regression. The 50-day SMA indicator is above the 14-day SMA indicator. The Stochastic Oscillators are in the overbought region, maintaining a southbound-swerving mode at 90.36 and 86.26 levels. The last four days of operations indicate the daily candlesticks are in negation to mirror the base crypto is relatively suffering a setback.
Note: Cryptosignals.org is not a financial advisor. Do your research before investing your funds in any financial asset or presented product or event. We are not responsible for your investing results.
You can purchase Lucky Block here. Buy LBLOCK