Litecoin (LTC/USD) Prices Possess a Bullish Momentum
Estimated Reading Time: 3 minutes
Don’t invest unless you’re prepared to lose all the money you invest. This is a high-risk investment and you are unlikely to be protected if something goes wrong. Take 2 minutes to learn more
Litecoin Price Prediction – March 21
Iangle of technical trading view has had it that the LTC/USD prices possess a bullish momentum below the resistance line of $90 as of this write-up. Buying moment has been between the spots of $83.119541 and $$77.006620 value lines at an average positive percentage rate of 5.39. The near pivotal support trading of the current uprising lies between 80 and $75.
LTC/USD Market
Key Levels:
Resistance levels: $90, $95, $100
Support levels: $70, $65, $60
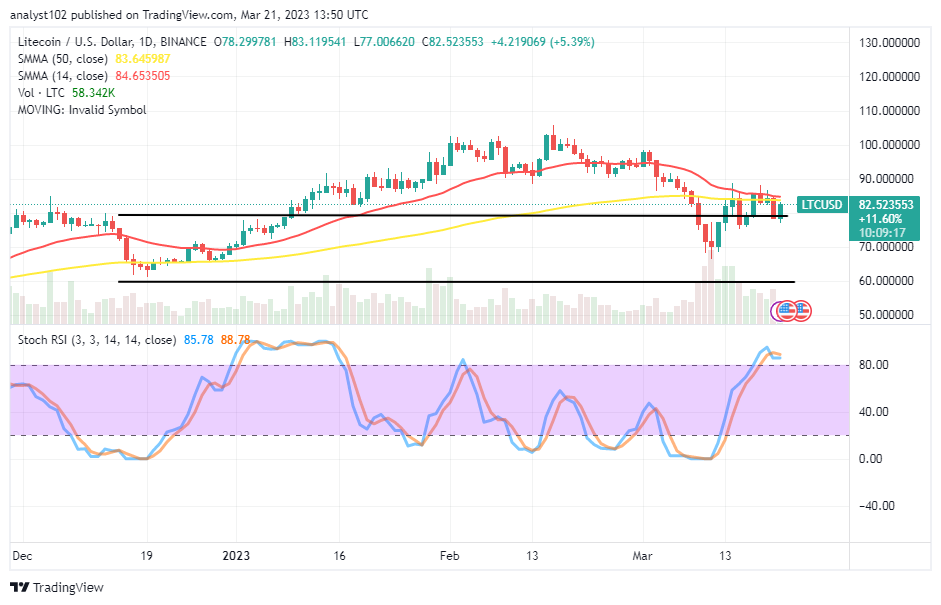
LTC/USD – Daily Chart
The LTC/USD daily chart reveals that crypto prices possess a bullish momentum over a point above the $70 support level. The 50-day SMA indicator is at $83.645987 value line underneath the 14-day SMA indicator, which is at $84.653505. And they are somewhat facing the eastward direction to serve a warning against jumping at a move anyhow. The Stochastic Oscillators are at 88.78 and 85.78 levels in the overbought region, showing that the upward trend can quickly reverse.
Should buyers follow any erratic movement that later breaks out in the LTC/USD trade at its SMAs’ points?
It might not be forthcoming on a sound technical inclination to have an instant execution of buying order when the LTC/USD market attempts to resort to an abrupt move against its SMA points even though the crypto prices possess a bullish momentum below the psychological resistance level at $90. The efforts to extend the appreciation of the market’s lines could expose hitting resistance between those values stated above afterward.
On the downside of the technical analysis, the LTC/USD market bears may regain their presence following a re-emergence of a bearish candlestick, especially when the price fails to uphold positions around the $90 resistance line. When implementing a shorting order position, sellers would need to keep an eye on observing a probable aggressive retracement action.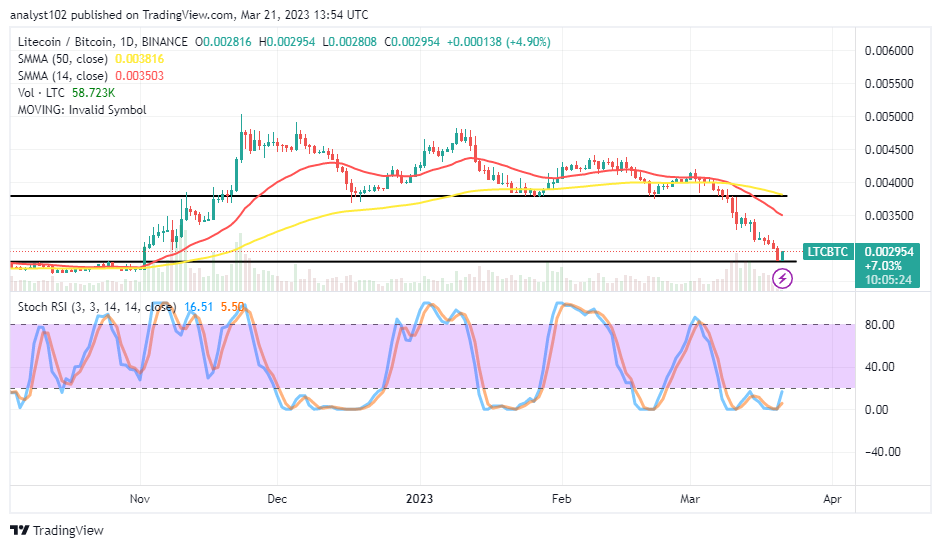
LTC/BTC Price Analysis
In comparison, Litecoin, as of the time of writing the technical piece, appears strongly at rising against the trending ability of Bitcoin over several sessions in the recent past. In other words, the crypto pairing prices possess a bullish momentum outlook on the current formation of a trading candlestick. The 14-day SMA trend line is underneath the 50-day SMA indicator. The Stochastic Oscillators are in the oversold region, trying to swing at 5.50 and 16.51 levels. That indicates that the base cryptocurrency’s opportunity to outperform the counter cryptocurrency is growing.
Note: Cryptosignals.org is not a financial advisor. Do your research before investing your funds in any financial asset or presented product or event. We are not responsible for your investing results.
You can purchase Lucky Block here. Buy LBLOCK