Ethereum Is in a Brief Downtrend, May Find Support above $4,270
Estimated Reading Time: 2 minutes
Don’t invest unless you’re prepared to lose all the money you invest. This is a high-risk investment and you are unlikely to be protected if something goes wrong. Take 2 minutes to learn more

Ethereum Price Long-Term Analysis: Bearish
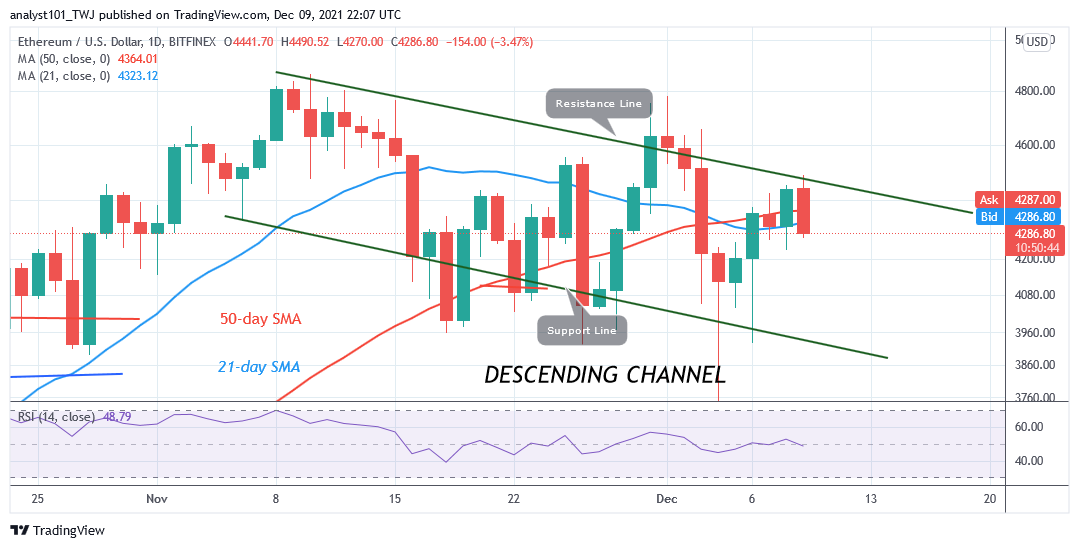
Following the December 4, bearish impulse, Ethereum (ETH) price plunged to $3,436 low as bulls bought the dips. The biggest altcoin resumed an upward move after the recovery. The market reached the high of $4,455 but buyers could not sustain the bullish momentum to the previous highs. Today, Ether is declining after facing rejection from the $4,500 resistance level. The bears have broken below the moving averages as price reaches the low of $4,292. The current fall may extend to the low of $4,038.
Ethereum Indicator Analysis
Ether is at level 48 of the Relative Strength Index for period 14. Ether is in the downtrend zone and capable of falling to the downside. The altcoin is presently falling to the downside. The crypto’s price is below the 21-day moving average and the 50-day moving average lines which indicates a possible fall of the altcoin. The cryptocurrency is below 40% area of the daily stochastic. The altcoin is in a bearish momentum.
Technical indicators:
Major Resistance Levels – $2, 600, $2,800, $3,000
Major Support Levels – $1.500, $1, 300, $1,100
What Is the Next Direction for Ethereum?
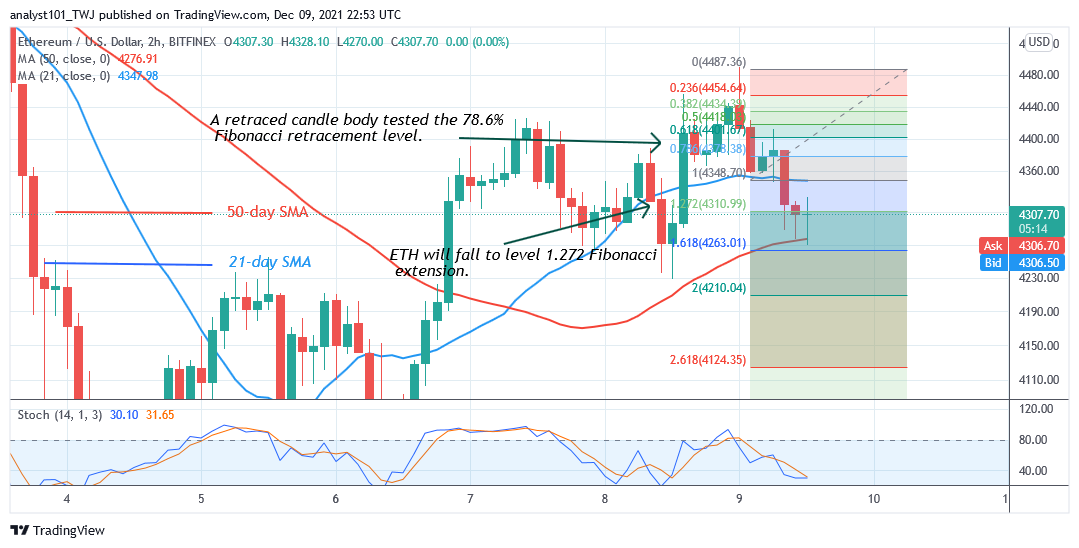
Since December 9, the largest altcoin has been in a downward move. Ether has fallen to the oversold region. There is a likelihood of an upward move. Meanwhile, on December 9 downtrend; a retraced candle body tested the 78.6% Fibonacci retracement level. The retracement indicates that Ethereum will fall to level 1.272 Fibonacci extension or $4,310.00.
You can crypto coins here. Buy Tokens
Note: Cryptosignals.org is not a financial advisor. Do your research before investing your funds in any financial asset or presented product or event. We are not responsible for your investing results