Litecoin (LTC/USD) Market Encounters Rejections Below SMAs
Estimated Reading Time: 3 minutes
Don’t invest unless you’re prepared to lose all the money you invest. This is a high-risk investment and you are unlikely to be protected if something goes wrong. Take 2 minutes to learn more
Litecoin Price Prediction – March 14
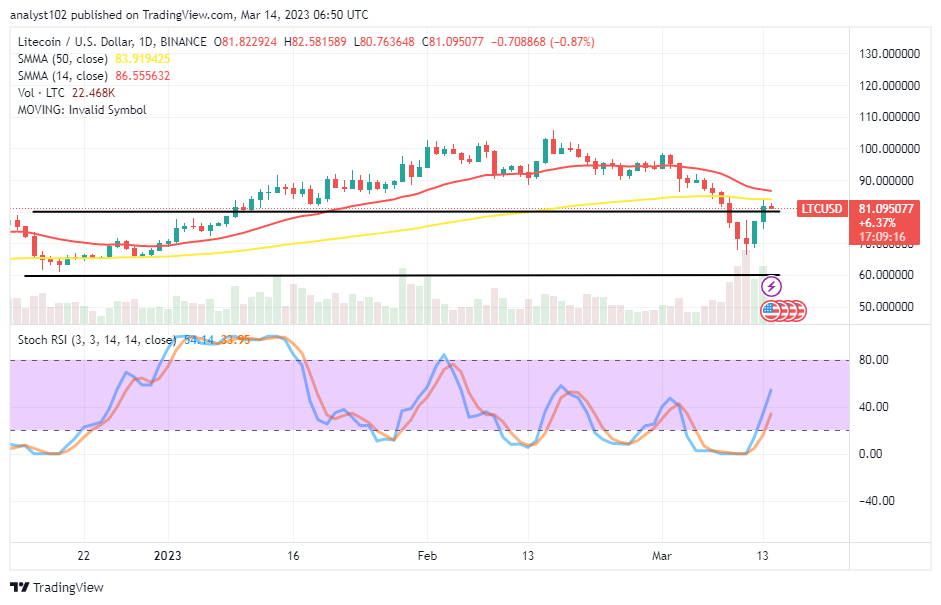
In recent operations, there had been significant decreases in the LTC/USD trade, and it had eventually allowed the price to locate support. The crypto market encounters rejections between $82.581589 and $80.763648 value lines. 0.87 percentage rate has been in focus to ascertain the pace at which the market is keeping as this technical piece has been. The forces moving northward risk losing steam below or close to the $90 resistance line.
LTC/USD Market
Key Levels:
Resistance levels: $90, $95, $100
Support levels: $70, $65, $60
LTC/USD – Daily Chart
The LTC/USD daily chart showcases the crypto market encounters rejections closely underneath the sell signal sides of the SMA trend lines. The 50-day SMA indicator is at $83.919425 below the $86.555632 value line of the 14-day SMA indicator. The Stochastic Oscillators have crossed northbound from the oversold region to reach 33.95 and 54.14 levels. That indicates a line of uprising pressures is in place.
Will the LTC/USD price drop below the $90 resistance level and enter a bear market?
It showcased the probability of seeing the LTC/USD price drop below the $90 resistance level t to enter a bear market as it observed the crypto economy encounters rejections. Before giving up and returning to a declining trend, there is still an effort for risings to test the resistances near the SMA trend lines. Buyers should use caution while following the presumptive rising momentum in light of such sentiment.
On the downside of the technical analysis, a bearish trading candlestick has formed to signal an opposing stance to achieve free flows of uprisings in the near sessions. Short-position placers have to be mindful of a cross of the Stochastic Oscillators to the south side to count upon in determining their sell entry order. Over time, it has been clear that the price will likely lose support above the $90 barrier level.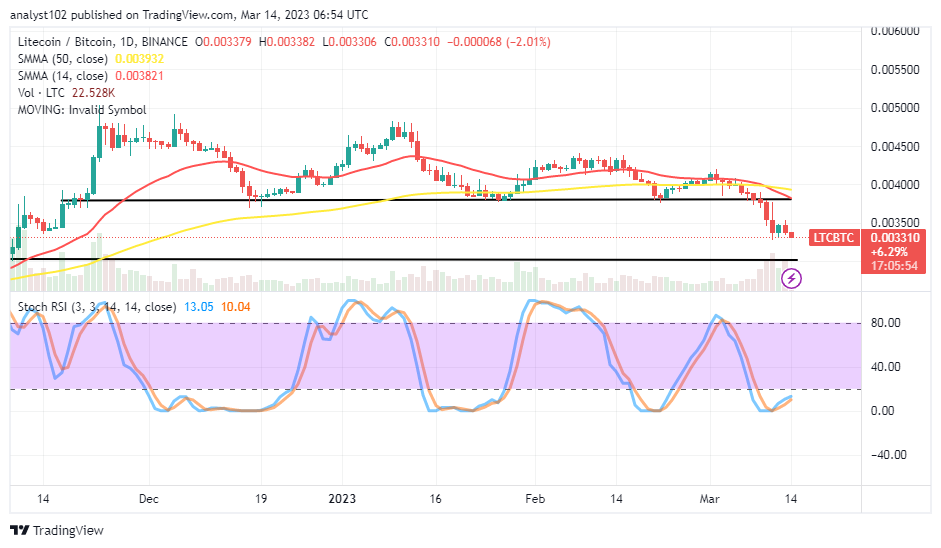
LTC/BTC Price Analysis
In comparison, Litecoin remains positively responding toward a declining move against Bitcoin. The 14-day SMA trend line has crossed southward against the 50-day SMA trend line. Variant formations of candlesticks have been in sequential order in the range-bound zones. The Stochastic Oscillators are in the oversold region, maintaining the 10.04 and 13.05 levels. It shows the base crypto-economy has been getting set for a rebound. But, buyers need to wait for the emergence of a bullish candlestick to confirm the cycle change.
Note: Cryptosignals.org is not a financial advisor. Do your research before investing your funds in any financial asset or presented product or event. We are not responsible for your investing results.
You can purchase Lucky Block here. Buy LBLOCK