Litecoin (LTC/USD) Market Debases Beyond $90
Estimated Reading Time: 3 minutes
Don’t invest unless you’re prepared to lose all the money you invest. This is a high-risk investment and you are unlikely to be protected if something goes wrong. Take 2 minutes to learn more
Litecoin Price Prediction – March 7
There have been more additions to the bears’ strength in the LTC/USD trade operations as the crypto economy debases beyond $90 to maintain a high and a low trading value line between $88.943435 and $86.115523. The current minute negative percentage rate is at 0.92, indicating that the gravitational capacity to the downside is weak. Hence the reason for fresh sellers to stay off for a while.
LTC/USD Market
Key Levels:
Resistance levels: $95, $100, $105
Support levels: $80, $75, $70
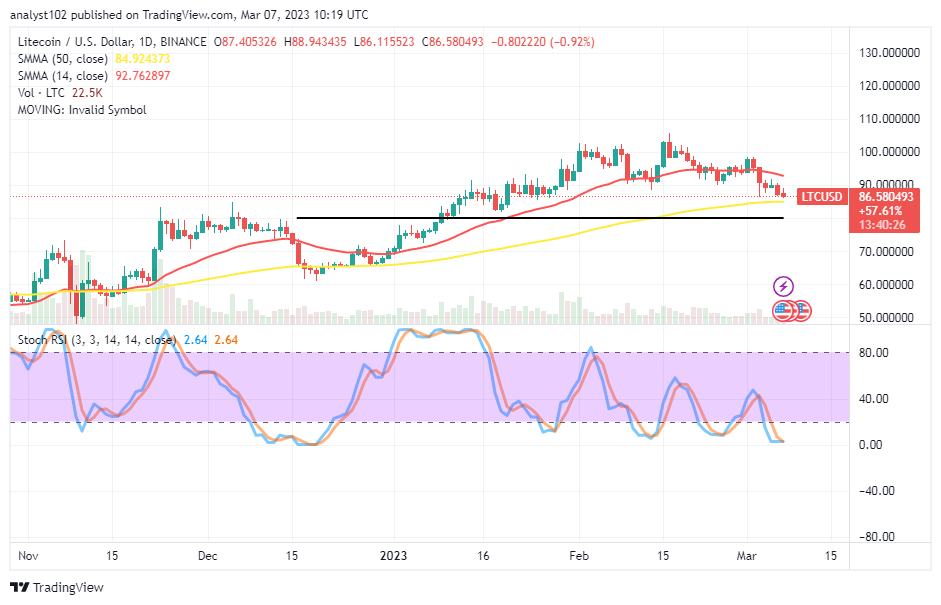
LTC/USD – Daily Chart
The LTC/USD daily chart reveals the crypto-economic market debases beyond the $90 to average some lows toward the $80 support level. The 14-day SMA indicator is at a $92.762897 value point above the $84.924373 line of the 50-day SMA indicator. The maximum low zone that bears will push in the long term is anticipated to be the horizontal line created at the $80 support point. The Stochastic Oscillators are in the oversold range and are holding steady at 2.64, indicating a halt session as of the writing of this article.
Has there been a sign that the LTC/USD market will debase maximally to the $80 support line afterward?
There has been no reliable signal to denote the LTC/USD market will decline abruptly to the $80 support level as the crypto economy debases beyond the $90 point. Until a spike emerges from within or near the points of the 50-day SMA trend line and the sketched horizontal line, long-position traders have to be wary of making a comeback. If the price tries to break through the horizontal line’s lowermost edge, the market will potentially settle for a revisit of the optimum support level at $70.
On the downside of the technical analysis, as it is, it seems not technically ideal to launch a shorting position order, if anything is to go by, the reading capacity of the selling force by the Stochastic Oscillators. Based on that sentiment, sellers should eschew instant order execution to avoid any unprecedented upsurge that can surface from the current oversold trading condition of the crypto business.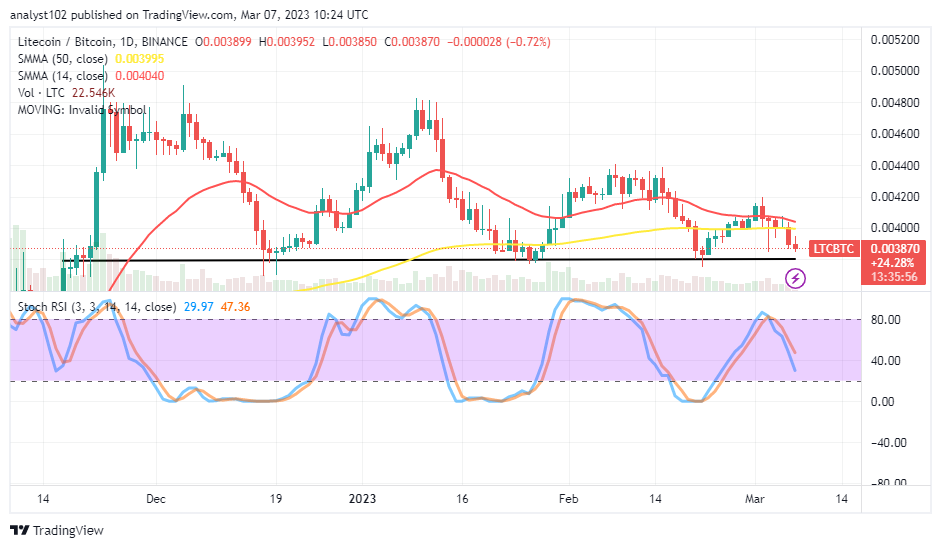
LTC/BTC Price Analysis
In comparison, Litecoin has been placed under a correction-moving mode against Bitcoin underneath the trend lines of the SMAs. The pairing crypto economy debases beyond the strategic trading points of the SMAs toward the horizontal line drawn below them. The Stochastic Oscillators have crossed southbound from around the 80 to 47.36 and 29.97 levels. The formation of the present bearish candlestick suggests the need to wait for the change of direction of the Oscillator tools toward the upside before thinking of making a buying order.
Note: Cryptosignals.org is not a financial advisor. Do your research before investing your funds in any financial asset or presented product or event. We are not responsible for your investing results.
You can purchase Lucky Block here. Buy LBLOCK