Litecoin (LTC/USD) Price Struggles for Recovery Over $90
Estimated Reading Time: 3 minutes
Don’t invest unless you’re prepared to lose all the money you invest. This is a high-risk investment and you are unlikely to be protected if something goes wrong. Take 2 minutes to learn more
Litecoin Price Prediction – February 28
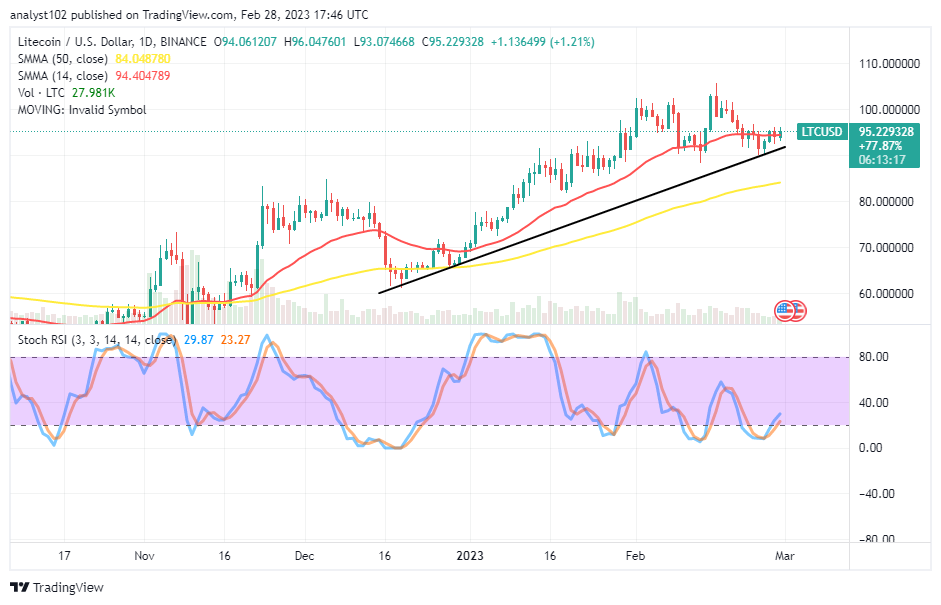
The significant declining motion in the LTC/USD market has been in force as the crypto-economic price struggles for recovery over the $90 support line. Buyers and sellers have come to maintain high and low trading zones of $96.047601 and $$93.074668 value lines at a positive percentage rate of 1.21. That shows sellers’ capacity to outweigh buyers beyond the point in question may not be forthcoming soon.
LTC/USD Market
Key Levels:
Resistance levels: $105, $110, $115
Support levels: $90, $85, $80
LTC/USD – Daily Chart
The LTC/USD daily chart showcases the crypto-economic price struggles for recovery over the $90 support level. The 14-day SMA trend line is at the $94.404789 value line, above the $84.048780 point of the 50-day SMA trend line. The Stochastic Oscillators have crossed northbound from the oversold region to 23.27 and 29.87 levels. Over a couple of days, a line of about four candlesticks has formed over the point in question to signify that some upward motions are in place.
Will the LTC/USD market depreciate past $90?
The emergence of a bearish trading candlestick against the bullish trend line drawn will suggest the possibility of seeing bulls losing stances in the following sessions as the LTC/USD trade struggles for a recovery over the $90 support level. The situation has shown that the price has partly formed a baseline around the support line toward building formidable high swings in the subsequent sessions. The moment the market breaches southward more past the levels around the first support axis, the price may head downward for a test of a lower point between the bigger SMA and the $80 if it will intensely afterward.
On the downside of the technical analysis, shorting of position orders may have to postpone until the market shows by the reading outlook of the Stochastic Oscillators to raise an overbought condition before considering to go a selling order. The barrier trading point remains to have built up around the $100 resistance level. However, a fearful break northward against the value line will give birth allowing bulls to prolong their pretense through the variant resistances stated above.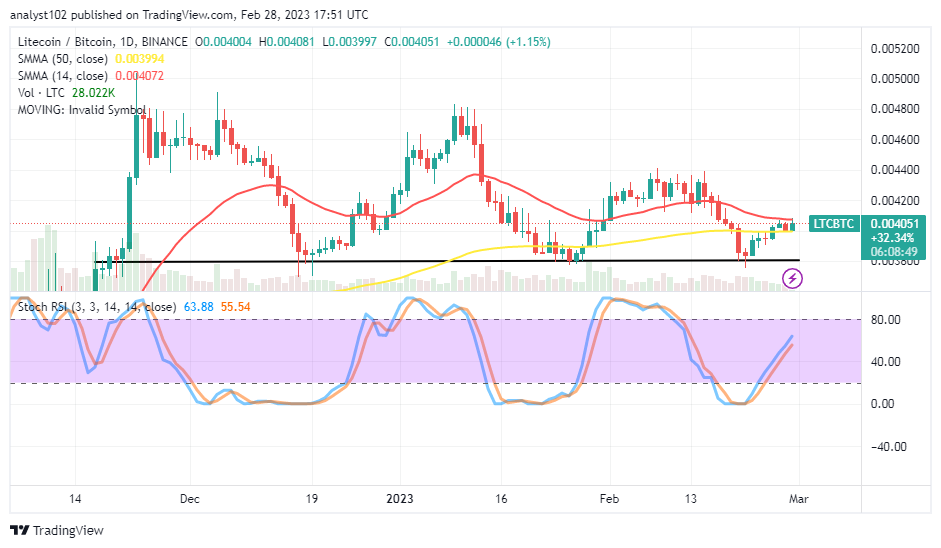
LTC/BTC Price Analysis
In comparison, the Litecoin market struggles to recover from a lower-trading point below the trend lines of the SMAs against Bitcoin. The 14-day SMA trend line is above the 50-day SMA trend line. The Stochastic Oscillators have swerved northbound from the oversold region to 55.54 and 63.88 levels. That shows the base crypto isa approaching an exhaustion period. If an overbought reading condition sees a significant bearish candlestick, a resumption of fall-offs will occur.
Note: Cryptosignals.org is not a financial advisor. Do your research before investing your funds in any financial asset or presented product or event. We are not responsible for your investing results.
You can purchase Lucky Block here. Buy LBLOCK