Litecoin (LTC/USD) Market Is in a Correction Mode
Estimated Reading Time: 3 minutes
Don’t invest unless you’re prepared to lose all the money you invest. This is a high-risk investment and you are unlikely to be protected if something goes wrong. Take 2 minutes to learn more
Litecoin Price Prediction – February 21
The degrees of motion between the buying and selling activities in the LTC/USD trade have resorted to a correction mode, keeping the pace within the high and the low of $96.824150 and $95.235581. As of the time of writing this technical trading piece, the price bags a minute positive percentage rate of 0.42. A buy signal has begun to appear more lightly, indicating that a change in trend is imminent.
LTC/USD Market
Key Levels:
Resistance levels: $105, $110, $115
Support levels: $90, $85, $80
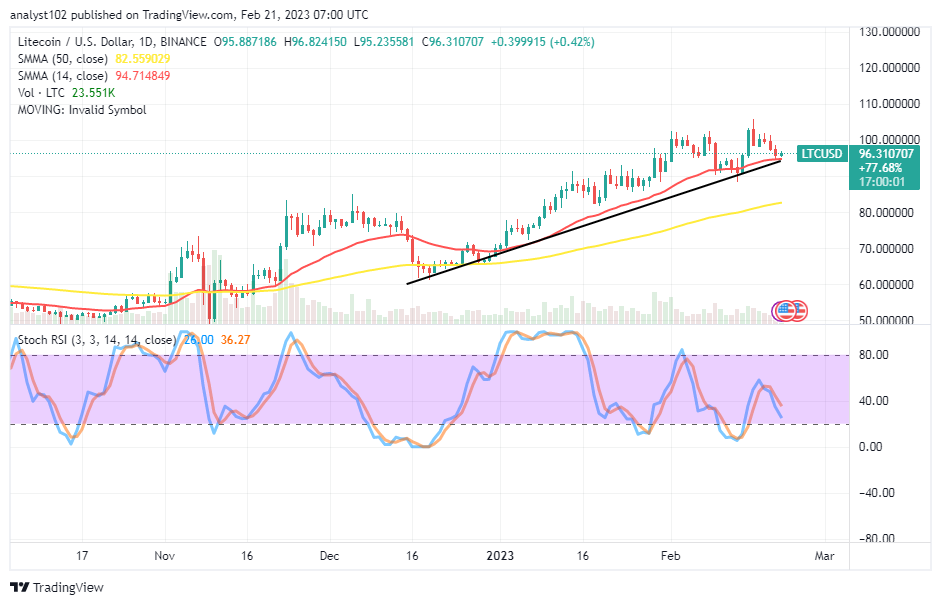
LTC/USD – Daily Chart
The LTC/USD daily chart showcases the crypto-economic market is in a correction mode extended toward the smaller SMA. The 14-day SMA indicator is at $94.714849 is above the $82.559029 of the 50-day SMA indicator. The bullish trend line has aligned northwardly with the smaller SMA. The Stochastic Oscillators have crossed southbound at 36.27 and 26 levels. A smaller bullish candlestick is in the making portending a near end to a decline.
What is the price action status over the LTC/USD trade SMA indicators?
An indecision-trading condition has been playing out in the LTC/USD trade as the crypto-economic market is in a correction mode. The Stochastic Oscillators have indicated that, despite the retracement process’s outlook, bulls will attempt to reclaim their positions around the drawn bullish trend line and the 14-day SMA trend line. Long-position traders should be cautious about placing new buy orders at this time.
On the downside of the technical analysis, it is still highly psychologically trickish to exert even an instant shorting order. Sellers may be close to getting a decent entry while in an overbought condition, sighted for some days’ sessions. The next higher-trading resistance spot to get that presumption will be between $105 and $110 before buyers tend to lose momentum in the long run.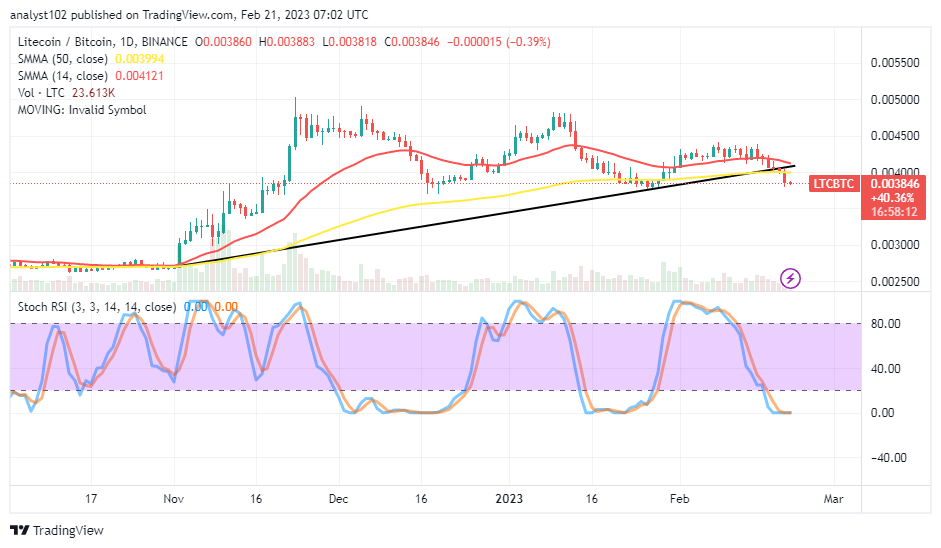
LTC/BTC Price Analysis
In comparison, Litecoin has declined significantly against the trending force of Bitcoin. The pairing cryptocurrency market is in a correction mode as it moves lower to a previous low value underneath the trend lines of the SMAs. The 14-day SMA indicator is beneath the 50-day SMA indicator. The stochastic Oscillators have dipped into the oversold region, keeping 0.00 and 0.00 levels to signify the base crypto is nearing a point of regaining an emergence of a high swing. To affirm that sentiment, a bullish or about two bullish candlesticks has or have to surface to back any possible moves to the upside.
Note: Cryptosignals.org is not a financial advisor. Do your research before investing your funds in any financial asset or presented product or event. We are not responsible for your investing results.
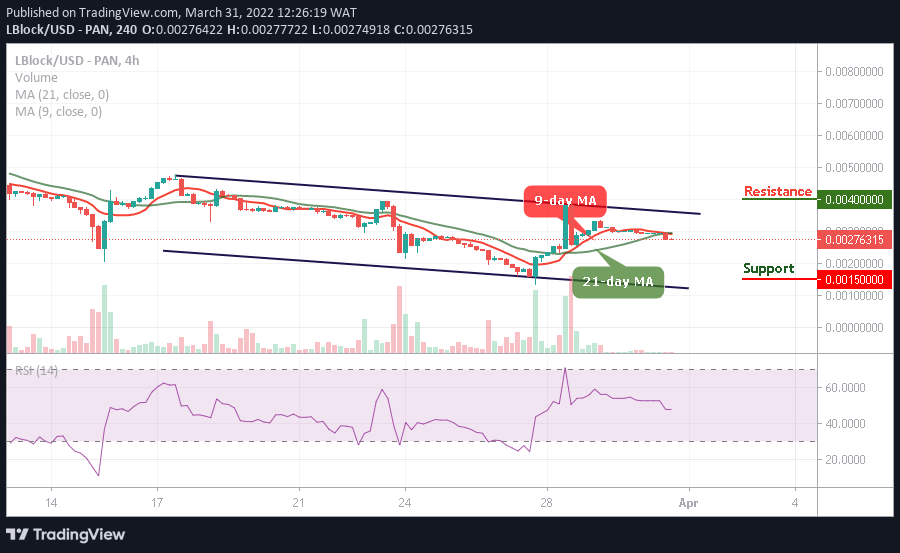
You can purchase Lucky Block here. Buy LBLOCK