Litecoin (LTC/USD) Price Reverses to Decide Direction at $90
Estimated Reading Time: 3 minutes
Don’t invest unless you’re prepared to lose all the money you invest. This is a high-risk investment and you are unlikely to be protected if something goes wrong. Take 2 minutes to learn more
Litecoin Price Prediction – February 14
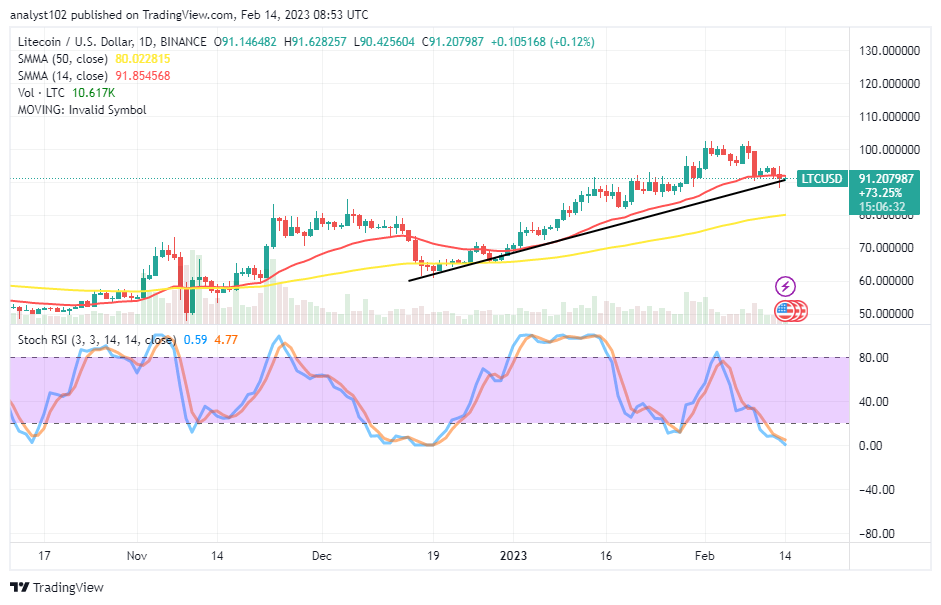
It is that the LTC/USD market bulls have failed to push northwardly further beyond the $100 resistance line as the crypto-economic price reverses to decide direction around the $90. Over a couple of trading hours into today’s session, the crypto-economic valuation has been between the high and low values of $91.628257 and $90.425604 at a minute average percentage rate of 0.12% positive.
LTC/USD Market
Key Levels:
Resistance levels: $110, $115, $120
Support levels: $85, $80, $75
LTC/USD – Daily Chart
It has been on the LTC/USD daily market chart shows the crypto-economic price reverses to decide direction around $90 following the inability to surge higher above the $100 resistance level in the recent operation. The 14-day SME indicator is at $91.854568 is above the $80.022815 value of the 50-day SMA indicator. The Stochastic Oscillators are in the oversold region, pointing southbound at 4.77 and 0.59 levels.
What is the probable velocity the LTC/USD trade posses currently around the $90?
The situation portends that the LTC/USD trade bulls lose momentum beneath the $100 resistance as the crypto’s price reverses to decide direction around the $90. Long-position placers would have to be sensitive toward spotting a bounce-off should the market slack in its motion to pass the bullish trend line drawn around the point in question over the 50-day SMA indicator. A sudden northbound-swerving posture will signify that an upward move will surface in the subsequent days.
On the downside of the technical analysis, it would be necessary for the LTC/USD market bears to long-hold their positions around the $90 in a consolidation mode to get more lows in the aftermath session. Nevertheless, a lot of time may require before significant volatile moves can be away from its current trading spot. It will be a riskier moment for sellers if a bullish candlestick is eventually over the value line mentioned earlier.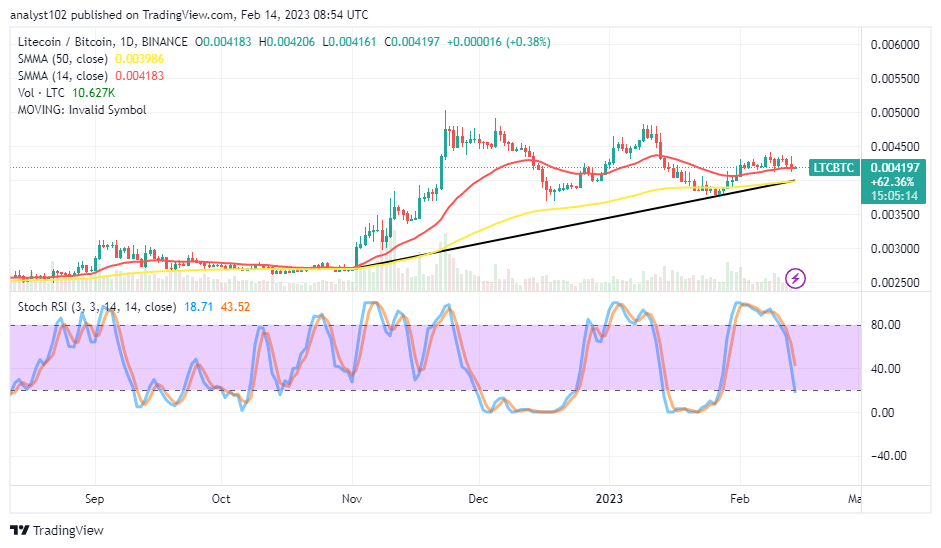
LTC/BTC Price Analysis
In comparison, Litecoin seems to be holding a slight southward-moving mode against Bitcoin, as the former instrument tends to decide the direction between the points of the two SMAs. The 14-day SMA indicator is closely above the 500-day SMA indicator. The Stochastic Oscillators are in a southbound-crossing style at 43.52 and 18.71 levels. That implies that the base cryptocurrency is falling at a slower rate. Buyers would be technically inclined to be cautious of taking new steps toward making a long position order based on that assumption.
Note: Cryptosignals.org is not a financial advisor. Do your research before investing your funds in any financial asset or presented product or event. We are not responsible for your investing results.
You can purchase Lucky Block here. Buy LBLOCK