Litecoin (LTC/USD) Market Attempts to keep a Bullish Trend
Estimated Reading Time: 3 minutes
Don’t invest unless you’re prepared to lose all the money you invest. This is a high-risk investment and you are unlikely to be protected if something goes wrong. Take 2 minutes to learn more
Litecoin Price Prediction – February 7
The obtainable trading outlook in the LTC/USD trade activities has mirrored that the crypto-economic market attempts to keep a bullish trend over some sessions in the recent past. Buyers’ and sellers’ pressure strength has remained between $99.679664 and $95.921891 value lines at an average percentage rate of 3.46 positive. Most indications are having it that buying moment will thrive over other directions.
LTC/USD Market
Key Levels:
Resistance levels: $110, $115, $120
Support levels: $85, $80, $75
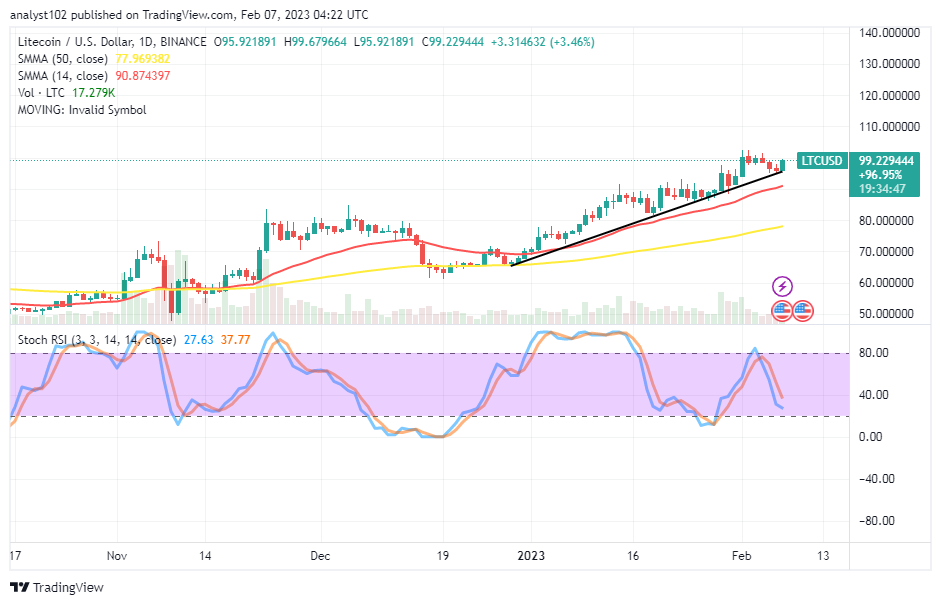
LTC/USD – Daily Chart
As of today’s analytics sentiment time, it is revealed on the LTC/USD daily chart that the crypto market attempts to keep a bullish trend over the buying signal side of the SMAs. The 14-day SMA indicator is at $90.874397 over the $77.969382 point of the 50-day SMA indicator. The bullish trend line is beneath the major psychological points to the upward side. The Stochastic Oscillators are at 37.77 and 27.63 levels, seemingly trying to cross back the blue line northbound close over the range of 20.
Will the LTC/USD trade operation soon reverse its current upward trend?
As indicated by the Stochastic Oscillators, it is likely to see more increases in the LTC/USD trade operation in the following sessions based on the trait that the crypto market attempts to keep a bullish trend outlook over the SMA indicators. A tangible bullish candlestick is in the making, affirming the probable energy buyers possess to get an edge above bears. The point of the 14-day could also serve as the baseline for bulls to build a baseline for swing highs.
Regarding the sentiment on the downside of the technical analysis, a move against today’s trading candlestick to the bottom may lead back the LTC/USD market positions to lower-trading spots. But, in the meantime, it would be technically okay to wait for formations of trading candlesticks at a higher-trading zone to denote the possibility of bears’ prevalence capacity to stage back into the transaction afterward. Selling activities may have to be put on hold for a while based on what is currently available signs.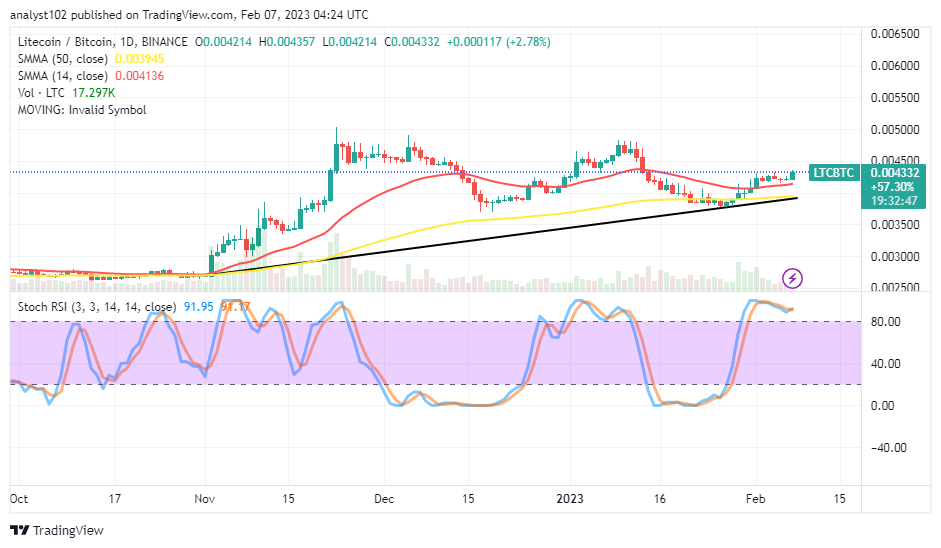
LTC/BTC Price Analysis
In comparison, Litecoin attempts to keep a bullish trend at a maximal higher-trading spot against the probability of Bitcoin’s pushing power in the near time. The outlook possesses that a situation needs to validate a resumption of corrections in the following sessions. The 14-day sMA indicator is closely above the 50-day SMA indicator. The Stochastic Oscillators are in the overbought region, keeping 91.17 and 91.95 levels to the advantage of the slightest uprises. That implies the base crypto is mooning relatively against its counter-trading crypto as this technical piece presumption time. But, there may soon be a retracement in no time, while a bearish candlestick emerges in the depth of a peak zone.
Note: Cryptosignals.org is not a financial advisor. Do your research before investing your funds in any financial asset or presented product or event. We are not responsible for your investing results.
You can purchase Lucky Block here. Buy LBLOCK