Litecoin (LTC/USD) Price Attempts to Hold Back Near $100
Estimated Reading Time: 3 minutes
Don’t invest unless you’re prepared to lose all the money you invest. This is a high-risk investment and you are unlikely to be protected if something goes wrong. Take 2 minutes to learn more
Litecoin Price Prediction – January 31
Litecoin trade valuation attempts to hold back near the $100 resistance line against the US Dollar purchasing power. A chain of highs and lows has recorded between $96.244847 and $91.301489 value lines, keeping a positive percentage rate of 3. As of writing this study, a bullish trend has been in relative-moving mode against other directions.
LTC/USD Market
Key Levels:
Resistance levels: $100, $105, $110
Support levels: $80, $75, $70
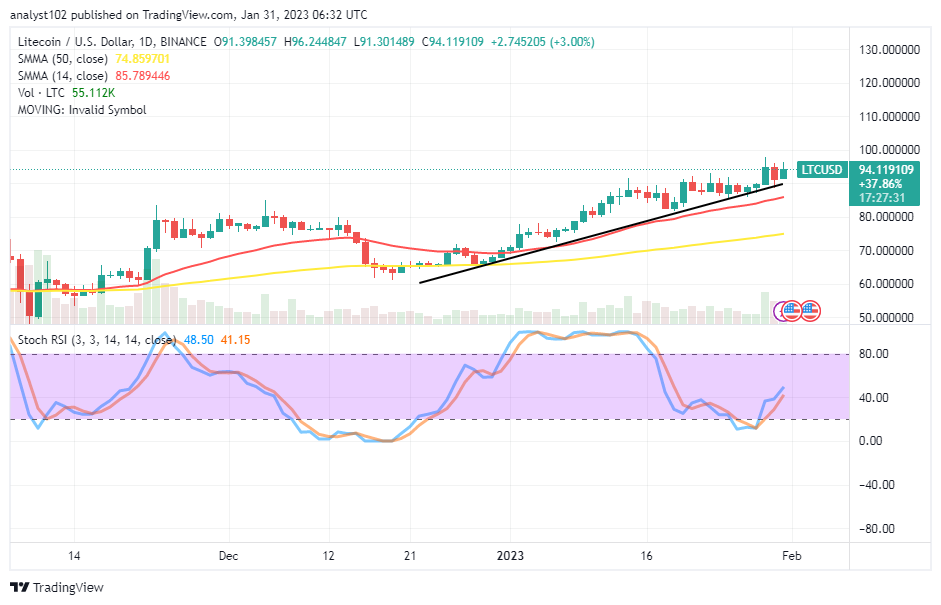
LTC/USD – Daily Chart
The LTC/USD daily chart reveals that the crypto-economic price attempts to hold back near the $100 above the buying signal of the SMA trend lines. The 14-day SMA indicator is at $85.789446 over the $74.859701. The bullish trend line drew northward past the trend lines of the SMAs to ascertain the points bulls have kept to the upside. The Stochastic Oscillators have crossed northbound from beneath the 20 levels in the oversold region to 41.15 and 48.50 levels, indicating that a buying force is still upholding.
Will the LTC/USD market continue to break through the barrier above $100?
The only concern technical challenge for the LTC/USD traders will be to observe a decent entry for their position orders even if the market has to spring northward further through the resistance beyond the $100 as the price attempts to hold back near the value line. Buying spree velocity may still occur systemically from the side of the 14-day SMA trend line point if a bearish candlestick doesn’t forcefully come to be afterward.
Regarding the sentiment on the downside of the technical analysis, emphasis has to place on the overhead resistance of the $100 as it would be necessary for sellers to be on the lookout for an effort of price trying to test before moving back to a downward direction. The Stochastic Oscillators will be highly instrumental in determining the exhaustion of pressures to the north side, especially if they are in the overbought reading condition. Based on that, bears are to be cautious of their fresh comebacks as of writing.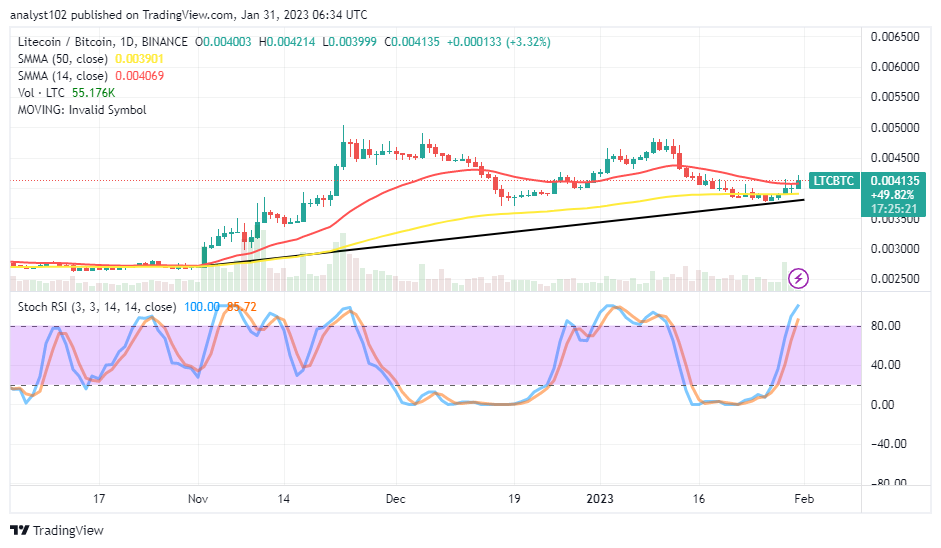
LTC/BTC Price Analysis
In comparison, Litecoin market valuation against the trending ability of Bitcoin seems to attempt to hold back near the trend lines of the SMAs. The 14-day SMA indicator is over the 50-day SMA indicator with a smaller distance between them. The bullish trend line drew closely beneath the trend lines of the SMAs, showcasing the overall trading outlook is in an upward-moving pattern. The Stochastic Oscillators are in the overbought region, positioning at 85.72 and 100 levels. As of the time of writing, an increase is ongoing.
Note: Cryptosignals.org is not a financial advisor. Do your research before investing your funds in any financial asset or presented product or event. We are not responsible for your investing results.
You can purchase Lucky Block here. Buy LBLOCK