Solana (SOL/USD) Market to Decline Below $20, Holding a Pause
Estimated Reading Time: 3 minutes
Don’t invest unless you’re prepared to lose all the money you invest. This is a high-risk investment and you are unlikely to be protected if something goes wrong. Take 2 minutes to learn more
Solana Price Prediction – June 23
The Solana market operation is set to decline below $20 against the US Dollar, holding a pause session around the trade zone of $16.
The transaction process between purchasing and selling activities is positioned at $17 and $16.18 value lines at 2.04 percentage rate positives. The gravitational impulse to the downside may risk heading toward the support line of approximately $15 to bottom out toward the $10 support line.
SOL/USD Market
Key Levels:.
Resistance levels: $20, $23, $26
Support levels: $15, $12.50, $10
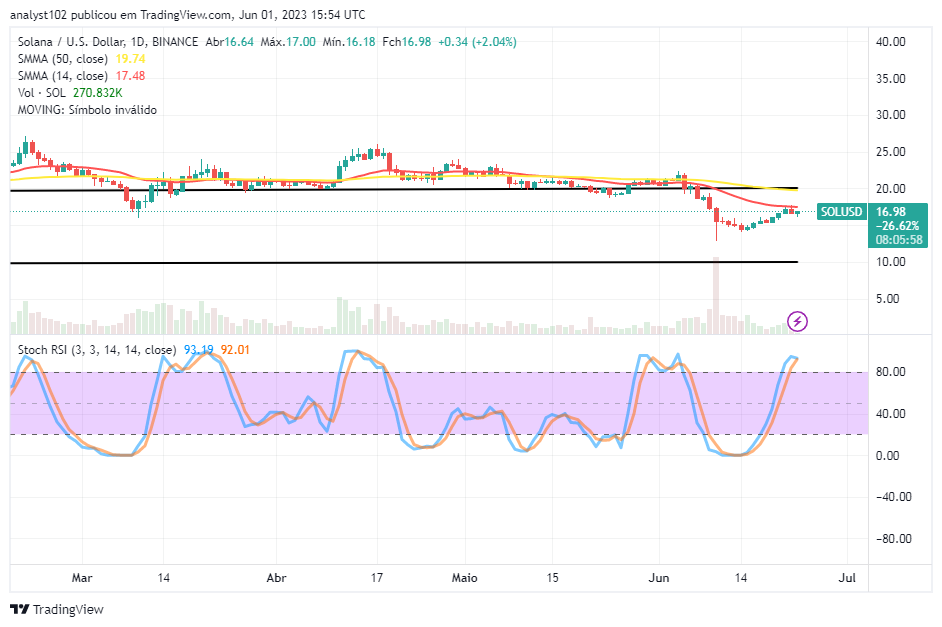
SOL/USD – Daily Chart
The SOL/USD daily chart showcases that the crypto-economic market is set to decline below $20, holding a pause session.
The 14-day SMA indicator is at $17.48, underneath the $19.74 value line of the 50-day SMA indicator. Variant trade candlesticks are displayed between the two horizontal lines marked at $20 and $10 points. The Stochastic Oscillators have moved into the overbought region, assuming positions from 92.01 to 93.19 points to suggest that a line of time passing will occur before pulling in a northward direction against resistances above $17.
What way is the SOL/USD price attempting to move next from its present trading point of the 14-day SMA?
At the moment of this technical piece, the SOL/USD trade has exhausted energy to beef up further away from the trend line of the smaller SMA, given that the crypto-economic market is set to decline at $20, holding a pause moment.
According to the technical analysis describing an assumption concerning the upward trend, long-position placers have to be wary of opening a position because there has been an emergence of a smaller bearish candlestick precisely underneath the trend line of the 14-day SMA. With the positioning posture of the Stochastic Oscillators, purchasers may be exposed to a retracement path in a lighter mood subsequently.
On the downward trending motion of the SOL/USD trade, the present outlook appears to garner a convergence of smaller lengths below the resistance of $20, utilizing the spot of the smaller SMA for a takeoff to the south side. Sellers are required to back their shorting entrance with a price action to avoid unnecessary execution of orders.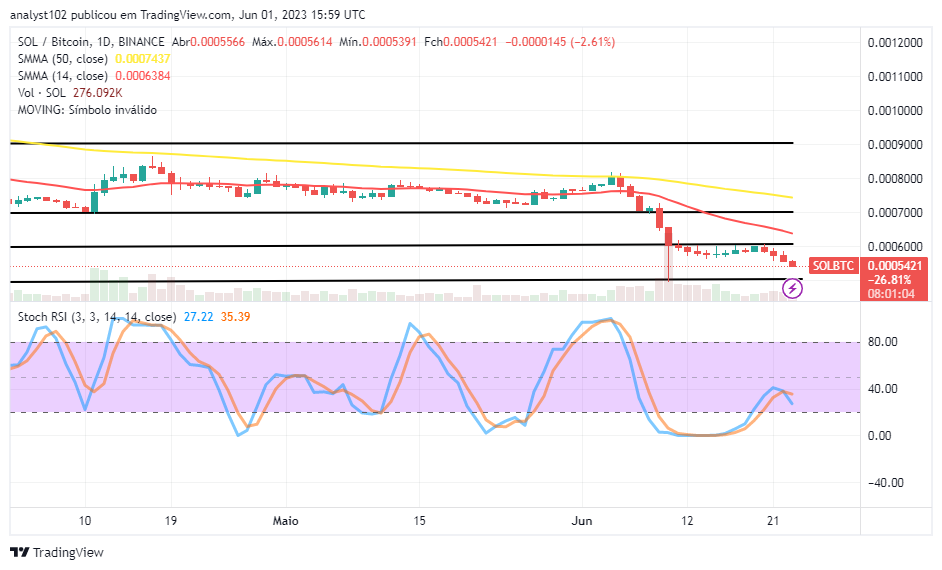
SOL/BTC Price Analysis
Contrasting the pushing ability of Solana with Bitcoin, the former trading instrument is set under a decline toward the lower horizontal line, holding a slow and steady motion toward its accomplishment.
The 14-day SMA indicator has bent slightly southward underneath the 50-day SMA signal. The Stochastic Oscillators have crossed southbound from 40 to 35.39 and 27.22 points, signaling that a degree of downs might still be held provided that no room is allowed for a trade candlestick that will signal a rising resume sign in the process.
Note: Cryptosignals.org is not a financial advisor. Do your research before investing your funds in any financial asset or presented product or event. We are not responsible for your investing results.
You can purchase Lucky Block here. Buy LBLOCK