Solana (SOL/USD) Price Is Rallying High, Attempting to Profit More
Estimated Reading Time: 3 minutes
Don’t invest unless you’re prepared to lose all the money you invest. This is a high-risk investment and you are unlikely to be protected if something goes wrong. Take 2 minutes to learn more
Solana Price Prediction – June 17
Bears’ trade reactions have been on an intensive-moving capacity that had broken through variant supports to touch around $13 before getting exhausted during the last week’s Saturday session, given that the crypto-economic price is rallying high, attempting to profit more. At the moment of this technicality write-up, transaction zones have been between $15.17 and $16.11 at an average percentage rate of 3.33 positives, which gives an impressive and reliable sign to opting for increases in the following operations.
SOL/USD Market
Key Levels:
Resistance levels: $19, $22, $25
Support levels: $15, $12.50, $10
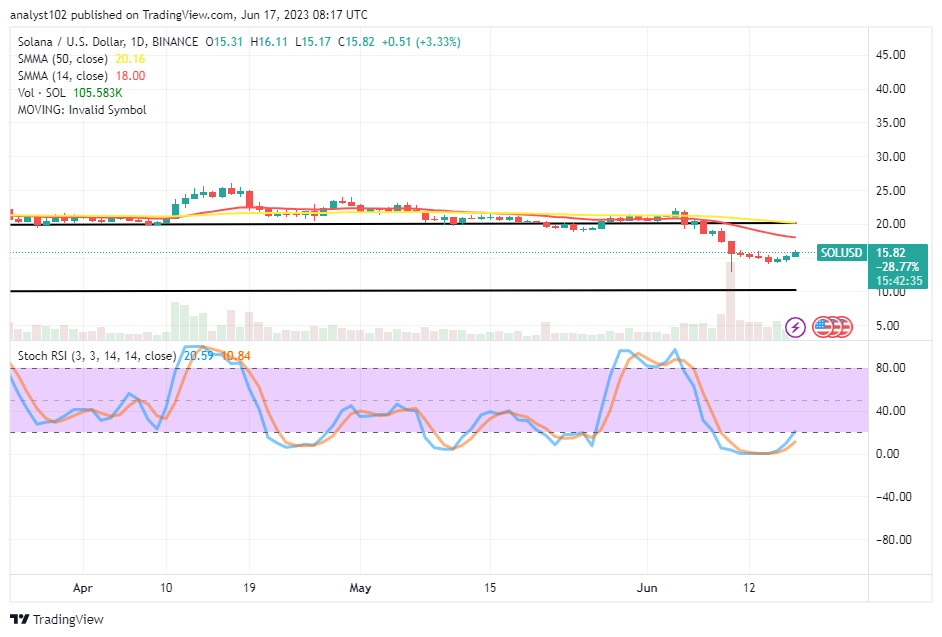
SOL/USD – Daily Chart
The SOL/USD daily chart showcases the crypto-economic price is rallying high, attempting to profit more from the depth of lower-trading zones below the SMA trend lines. The 14-day SMA indicator is at $18, seemingly tempting to curve back northward underneath the $20.16 value line of the 50-day SMA indicator. According to this psychological trade hypothesis, long positions need only continue pushing efforts through the breach of the 14-day SMA’s $18 before the subsequent turbulence phase.
Will the SOL/USD market operations resume a downward motion against its current positive trade index?
The expectation is that the SOL/USD market buyers will keep their positions afloat over the last touched point visited the last week’s Saturday decline. Investors should always abide by the principle of holding positions in the long-term running mode toward reclaiming lost higher opened longing positions. Based on that psychological trade belief, buyers advance their pushing efforts through the $18 of the 14-day SMA ahead of the subsequent volatile period to reclaim further higher points.
On the downward trending motion of the SOL/USD market technical analysis, the current moving pace tends to face resistance around or between the values of the 14-day and 50-day SMA trend lines of $18 and $20.16 in the run. Long-term losses will follow if the Stochastic Oscillators get repositioned in the overbought region with a probable occurrence that prevents candlestick formation beyond those SMAs’ points.
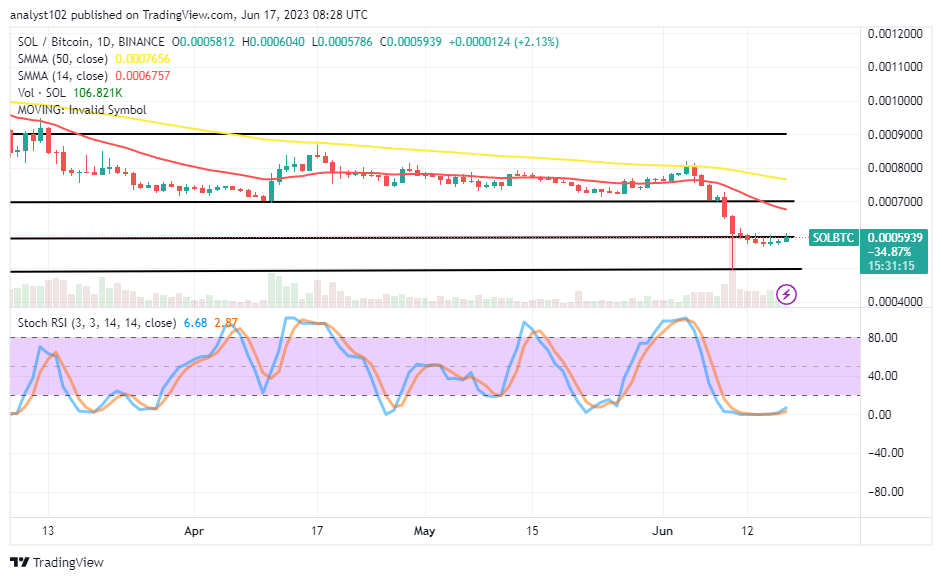
SOL/BTC Price Analysis
Contrasting the trending weight of Solana with Bitcoin, presently, the pairing cryptocurrency price is rallying high, attempting to profit more from the beneath-sell signal side of the SMA trend lines. The 14-day SMA indicator is below the 50-day SMA indicator. The Stochastic Oscillators have formerly conjoined around the zero point in the depth of the oversold region before maintaining 2.87 and 6.68 levels to the upside. That suggests buyers are amassing momentum against the counter crypto in the base crypto market. It also demonstrates that longing orders will win out.
Note: Cryptosignals.org is not a financial advisor. Do your research before investing your funds in any financial asset or presented product or event. We are not responsible for your investing results.
You can purchase Lucky Block here. Buy LBLOCK