Solana (SOL/USD) Price Possesses Less-Active Upward Moves
Estimated Reading Time: 3 minutes
Don’t invest unless you’re prepared to lose all the money you invest. This is a high-risk investment and you are unlikely to be protected if something goes wrong. Take 2 minutes to learn more

Free Crypto Signals Channel
Solana Price Prediction – September 30
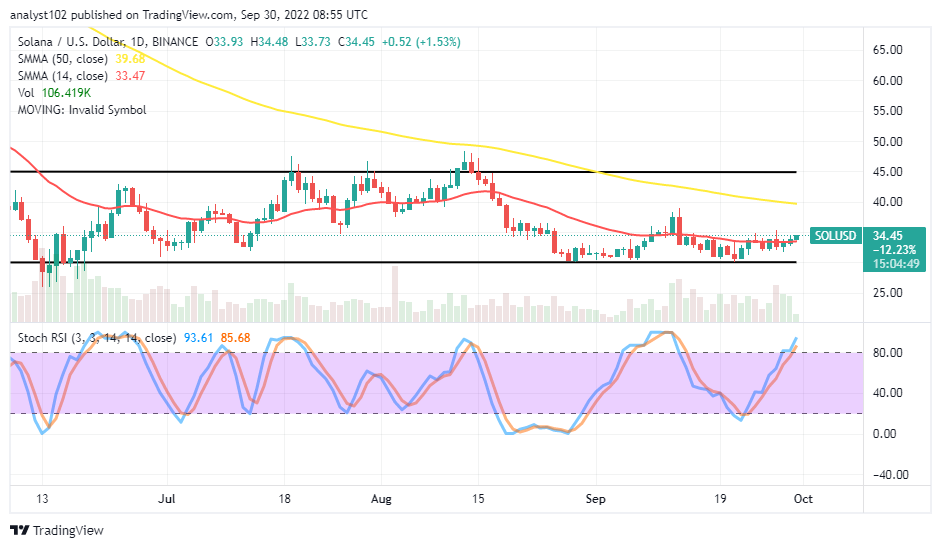
As of the time of writing, the SOL/USD market price possesses less-active upward moves weight as it trades around the $34.45 value line. The crypto economy maintains an average percentage rate of 1.53 positive.
SOL/USD Market
Key Levels:
Resistance levels: $40, $45, $50
Support levels: $30, $25, $20
SOL/USD – Daily Chart
The SOL/USD daily chart showcases the crypto market price possesses less-active upward moves capacity at the moment around the trend line of the smaller SMA. The 14-day SMA indicator is at $33.47, underneath the $39.68 value line of the 50-day SMA indicator. The Stochastic Oscillators have penetrated the overbought region, slightly pointing northbound at the range values of 85.68 and 93.61 to indicate the possibility of pushing northward further is carrying a minute strength pace.
Are there still reliable upward moves in the SOL/USD market above its current trading point?
It appears reliable upward motions in the SOL/USD market operations are unrealistic above its present bargaining zone as the price possesses less-active upward moves. Buyers should be wary of any sudden breakdown around the trend line of the smaller SMA. Therefore, long=position placers have to suspend their buying execution order, especially if there will be anything to go by from the current reading of the Stochastic Oscillators.
On the downside of the technical analysis, the trading situation is seemingly heading toward getting a pattern to reset to show off resistance-hitting conditions below the trend line of the 50-day SMA. The Stochastic Oscillators will remain the better-of-trading tool for early direction exhaustion. But, at this point, investors need not panic about selling their portfolios off.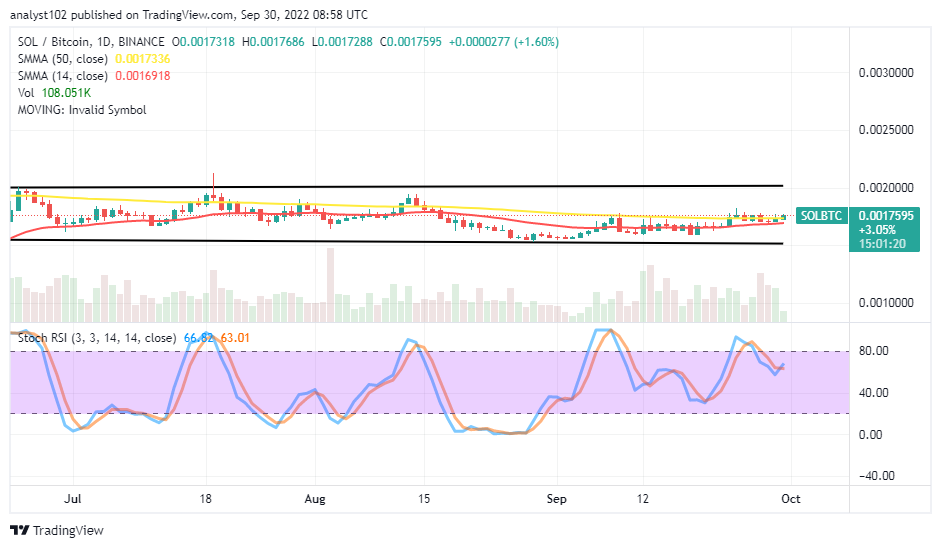
SOL/BTC Price Analysis
In comparison, Solana has continued trending eastwardly against the pushing weight of Bitcoin over time. As of the time of writing, the cryptocurrency pair price possesses less-active upward moves around the trend line of the bigger SMA trend line. The 14-day SMA indicator has briefly curved northward, closely to the 50-day SMA indicator from beneath. The Stochastic Oscillators have swerved southbound from the overbought region to get repositioned to cross back northbound at 63.01 and 66.82. If a bearish candlestick emerges at a high-trading zone, the base crypto will risk debasing, pairing with the trending pace of the counter crypto afterward.
Note: Cryptosignals.org is not a financial advisor. Do your research before investing your funds in any financial asset or presented product or event. We are not responsible for your investing results.
You can purchase Lucky Block here. Buy LBLOCK