Cardano (ADA/USDT) Faces Strong Resistance at the $0.3690 Level
Estimated Reading Time: 3 minutes
Don’t invest unless you’re prepared to lose all the money you invest. This is a high-risk investment and you are unlikely to be protected if something goes wrong. Take 2 minutes to learn more
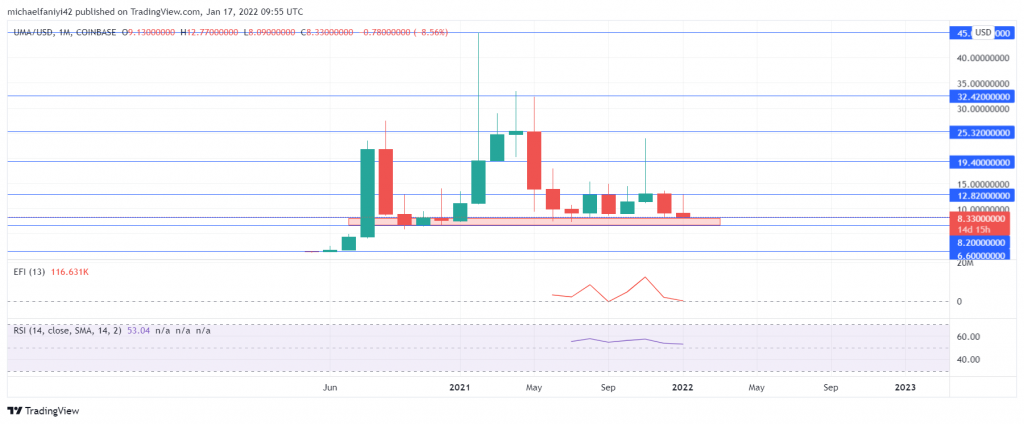
Cardano Long-term Analysis: Bearish
The third-generation blockchain, Cardano (ADA), against the Tether (USDT), has been on a prolonged downtrend since the first quarter of 2024, with difficulty gaining significant height. However, the pair is still hovering around another resistance level; the question remains whether an uptrend or continuous downtrend is possible, as the Bollinger band signal oversold, while the Stochastic RSI suggests a slightly overbought condition.
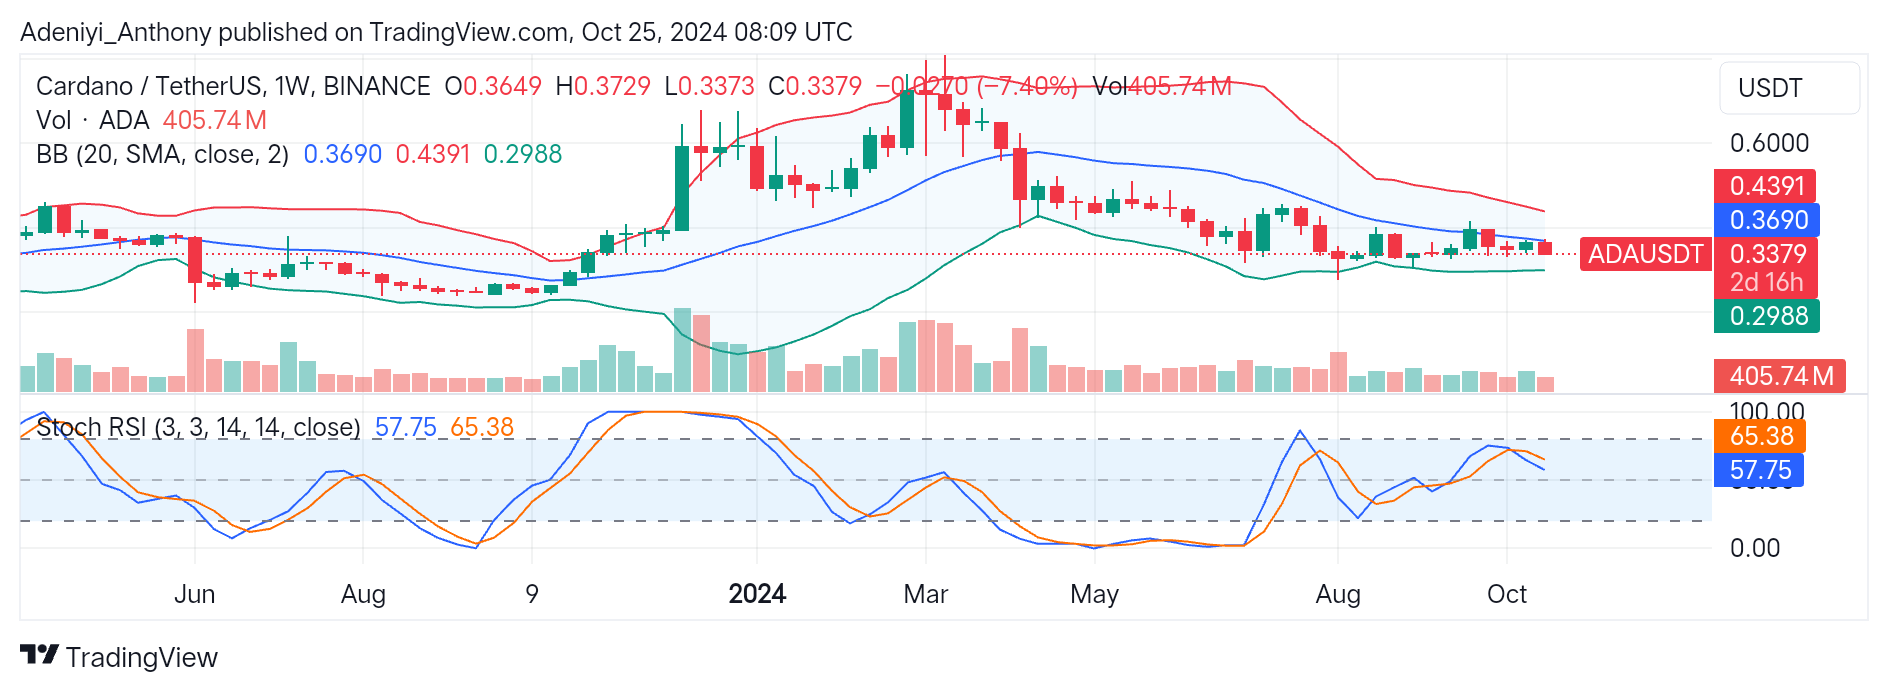
Recently, ADA/USDT has shown signs of indecision as the price keeps hovering between tight levels around the $0.3690 and $0.2988 lower segment of the bands. Furthermore, with over 400 million trading volumes and a decline in price, the selling pressure in this market is very strong. To this end, a bullish reversal is possible with a stabilized price after the selling pressure eases out.
Currently, the pair trades at $0.3379 with a 7.40 decline from the last trade.
Technical Indicators
Major Resistance Levels: $0.3690, $0.4391, and $0.5000
Major Support Levels: $0.3373, $0.2988, and $0.2970
Cardano Technical Analysis
Cardano is facing a challenging period with the price struggling to hold above recent support levels. Currently, the pair is consolidating around the tight lower segment of the Bollinger band, which typically indicates impending breaking. However, with this condition, the price might see a trend reversal after a minor decline in the short term if the pair finds strong support at $0.2988; otherwise, new support and resistance levels will be formed.
From the Stochastic side, Cardano has been oscillating around the 50-mark level, also suggesting a lack of decision in the market. However, the recent line crossover suggests potential bearish momentum may be building up.
Traders should keep an eye on the lower band at $0.2988 because any breakout below this level could signal further sell-offs. Conversely, a recovery above the $0.3690 could breathe new life into the bullish traders.
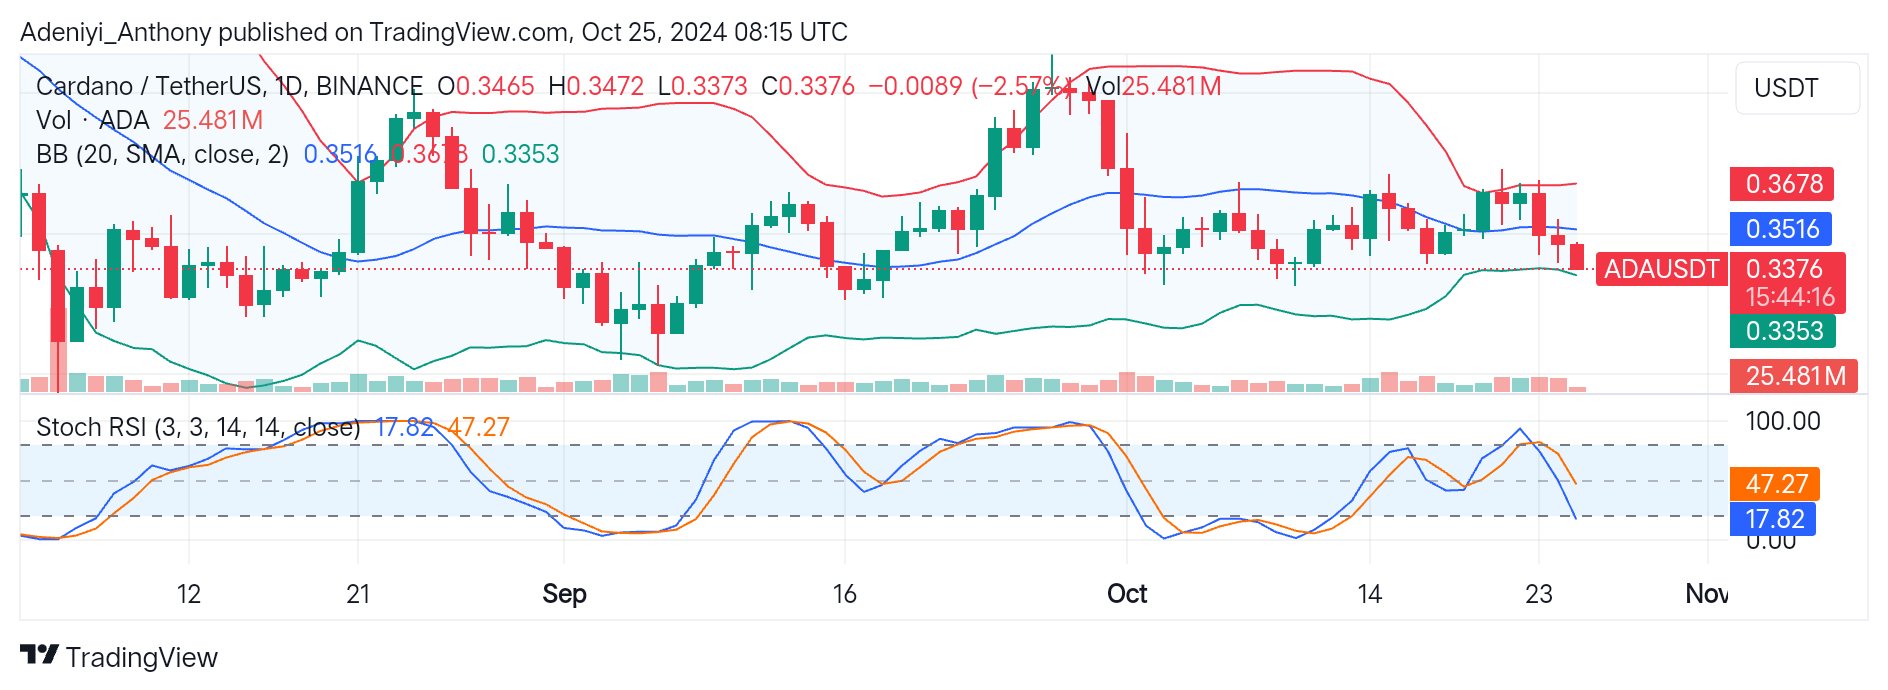
ADA/USDT Analysis: a Pullback or a Continued Downtrend?
ADA/USDT is trading at $0.3376 on a daily timeframe between narrowed bands. However, in this timeframe, Cardano is in a short-term downtrend very close to the lower band at $0.3353; a break below this level would signal a continuation of the downtrend. Conversely, a pullback at this level will happen if bullish traders take swift action.
At the downside of the chart, the Stochastic oscillator is approaching the oversold region, and maintaining this position would suggest a continuation of the bearish trend. However, a spike in volume and an improvement to the upside would indicate a trend reversal.
The $0.3353 and $0.3516 are the key levels in this analysis, as a break below the former suggests a further downtrend, while a break above the latter indicates improvement to the North.
You can purchase crypto coins here. Buy LBlock