Cardano (ADA/USD) Upside Retracement Faces Rejection Around $0.38
Estimated Reading Time: 3 minutes
Don’t invest unless you’re prepared to lose all the money you invest. This is a high-risk investment and you are unlikely to be protected if something goes wrong. Take 2 minutes to learn more
Cardano Long-term Analysis: Bearish
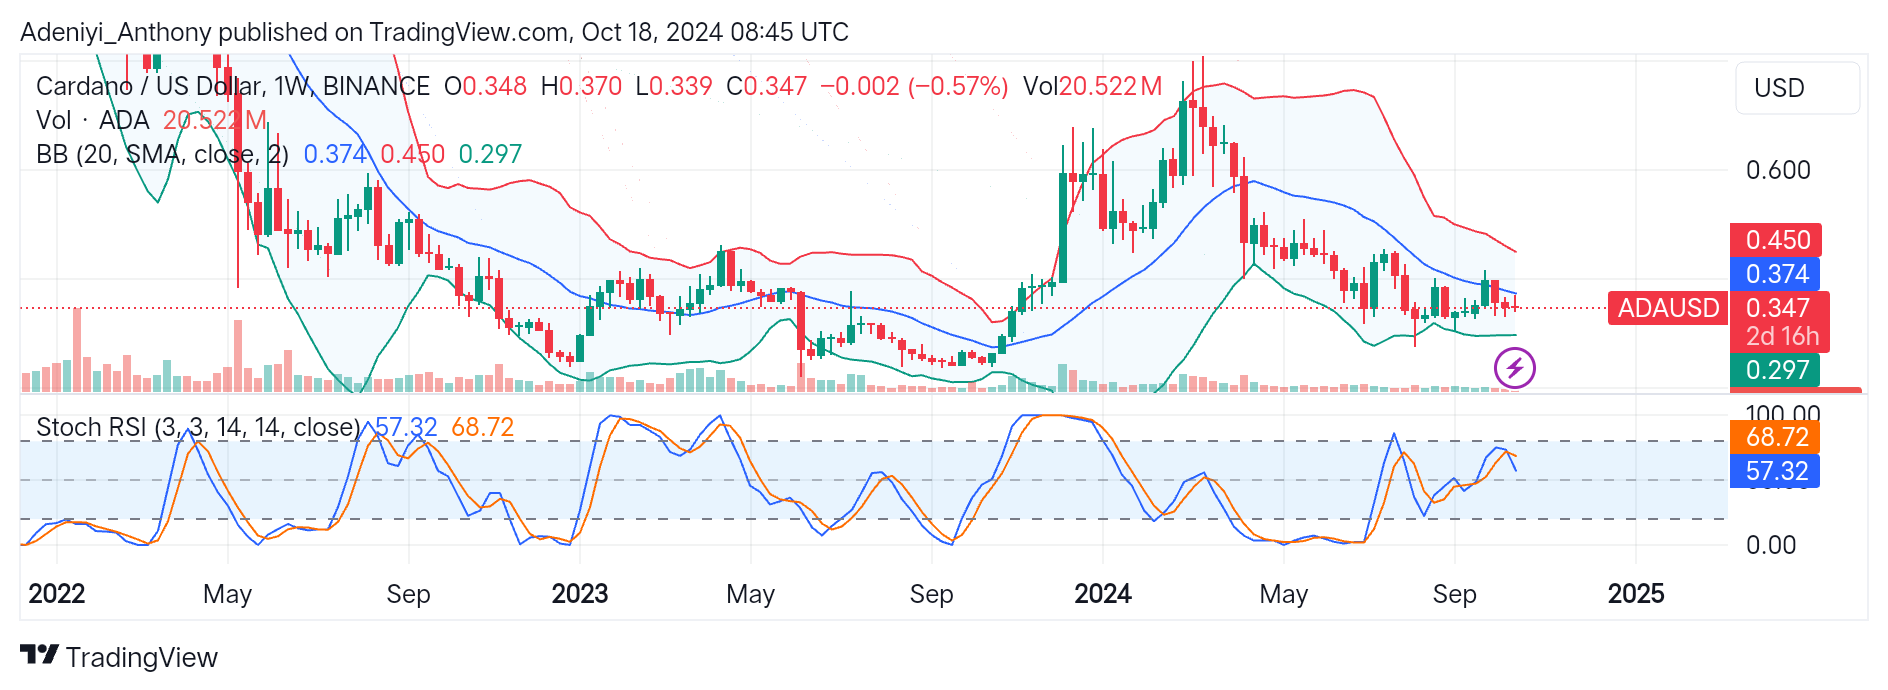
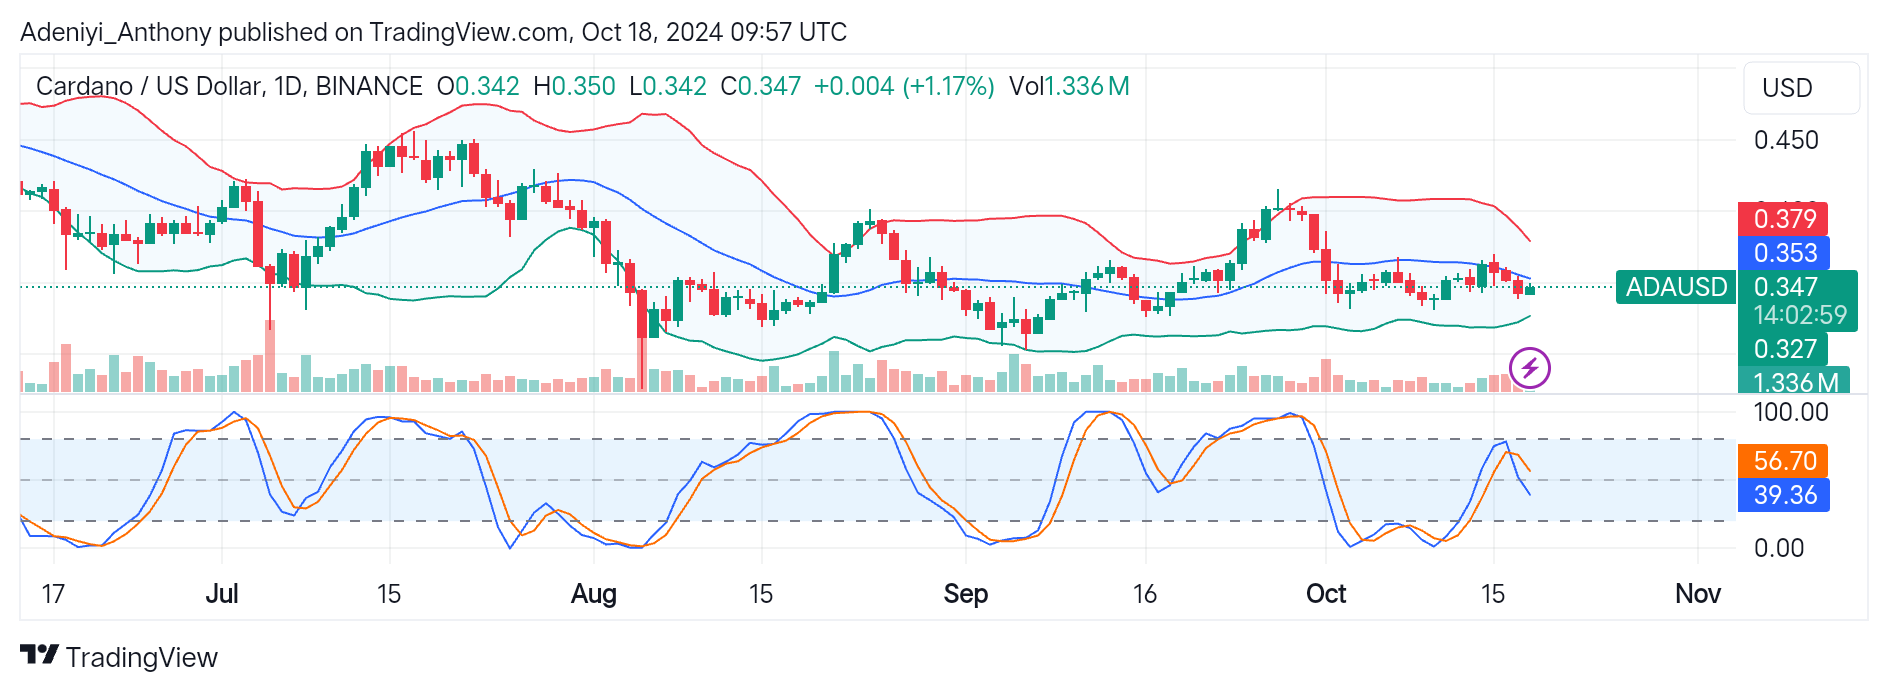
Cardano’s price movement against the United States Dollar has fluctuated over the past few weeks. However, the price hangs near the dynamic mid-band after it could not break above the $0.374 level.
Generally, ADA/USD has been facing bearish pressure since the second quarter of 2024. As a result, all potential recovery has met stronger downward pressure.
In recent times, ADA/USD has been oscillating between $0.297 and $0.374, with the formation of highs and lows in a downtrend. Typically, the pair’s operation between these levels signifies an oversold condition. However, the Stochastic oscillator underneath signifies a further dip as a crossover to the south has been spotted.
The current suspension around the middle band suggests the market is in a waiting phase, and a break above $0.374 will signal renewed bullish momentum. However, with the relatively stable volume, a break below $0.297 signals a weakness of the bullish strength and a further downtrend.
ADA/USD currently trades at $0.347, slightly below the first resistance level.
Technical Indicators
Major Resistance Levels: $0.374, $0.450, and $0.500
Major Support Levels: $0.297, $0.280, and $0.250
Cardano Technical Analysis
In a complex interplay of cardano trends under the middle Bollinger band, ADA/USD oscillates between $0.3 and $0.2 levels with breakout potential.
The narrowed bands on the chart suggest low volatility and an upcoming large price movement. However, the operation of the pair at the lower end of the band suggests strong bearish pressure and a fall below $0.297 will lead to further decline.
On the other hand, the appearance of the orange line above the blue line near the oversold region indicates declining momentum and trade below the lower band will cement this claim.
In the meantime, traders should exercise patience, as the formation of lower highs and lower lows means a breakout is on the horizon. However, the $0.374 and $0.297 levels are the key levels to watch because the market direction is not clear.
ADA/USD at a Crossroads: What’s Next?
ADA/USD, in the daily timeframe, operates between a squeezed Bollinger band, which typically precedes breakout. With the price at $0.347, a break above the upper band at $0.397 could trigger a bullish rally; otherwise, a break below $0.327 would signal a further downtrend.
On the downside, the Stochastic RSI suggests weak momentum with a downward line crossover. With this, it is clear that as the line approaches the oversold region, the pair may experience a slight pullback before further declines. On the other hand, a bullish trend will be seen if the pair makes a turn to the upside.
You can purchase crypto coins here. Buy LBlock