Bitcoin Price Prediction: BTC/USD Could Turn Attractive Above $60,000
Estimated Reading Time: 3 minutes
Don’t invest unless you’re prepared to lose all the money you invest. This is a high-risk investment and you are unlikely to be protected if something goes wrong. Take 2 minutes to learn more

Bitcoin (BTC) Price Prediction – June 30
The Bitcoin price prediction reveals that BTC may break out of the current short-term pattern and move toward the $ 63,000 level.
BTC/USD Long-term Trend: Ranging (Daily Chart)
Key levels:
Resistance Levels: $70,000, $72,000, $74,000
Support Levels: $54,000, $52,000, $50,000
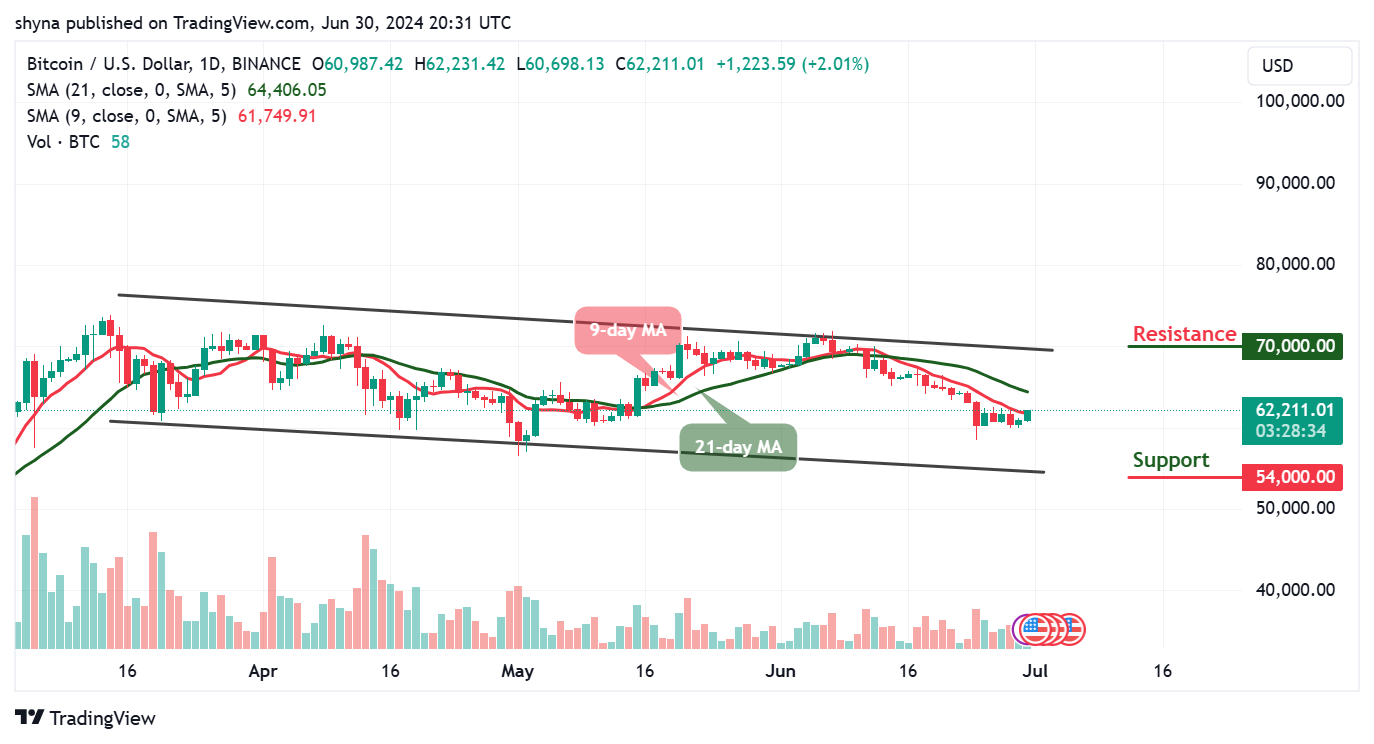
BTC/USD is at the moment trading at $62,211 with a 2.01% gain since the beginning of today’s trading. The Bitcoin price may cross above the 9-day moving average. Moreover, for BTC/USD to remain above this barrier, it could make many traders feel that the $60,000 support level could be pretty strong.
Bitcoin Price Prediction: Would BTC Price Break Higher
The Bitcoin price could not drop much cause of today’s trading, but if the first digital coin breaks below the support level of $60,000, it could change the direction of the coin to face the lower boundary of the channel. Alternatively, Bitcoin (BTC) may reclaim the previous resistance level of $65,000 to head to the upside. If successful, BTC/USD could aim at the resistance levels of $70,000, $72,000, and $74,000 respectively.
Nevertheless, the 9-day moving average is yet to cross above the 21-day moving average as the coin may consolidate these barriers. Moreover, this could mean that there may still be a room that the bears could explore if they head toward the lower boundary of the channel. Therefore, the support levels of $54,000, $52,000, and $50,000 may play out.
BTC/USD Medium-term Trend: Ranging (4H Chart)
From a technical point of view, on the 4-hour chart, the 9-day MA is seen crossing above the 21-day MA, and this may confirm the bullish movement if it crosses above the upper boundary of the channel. Meanwhile, adding to the above, there could be a bit of bullish divergence as soon as the coin crosses above the channel to continue the bullish movement.
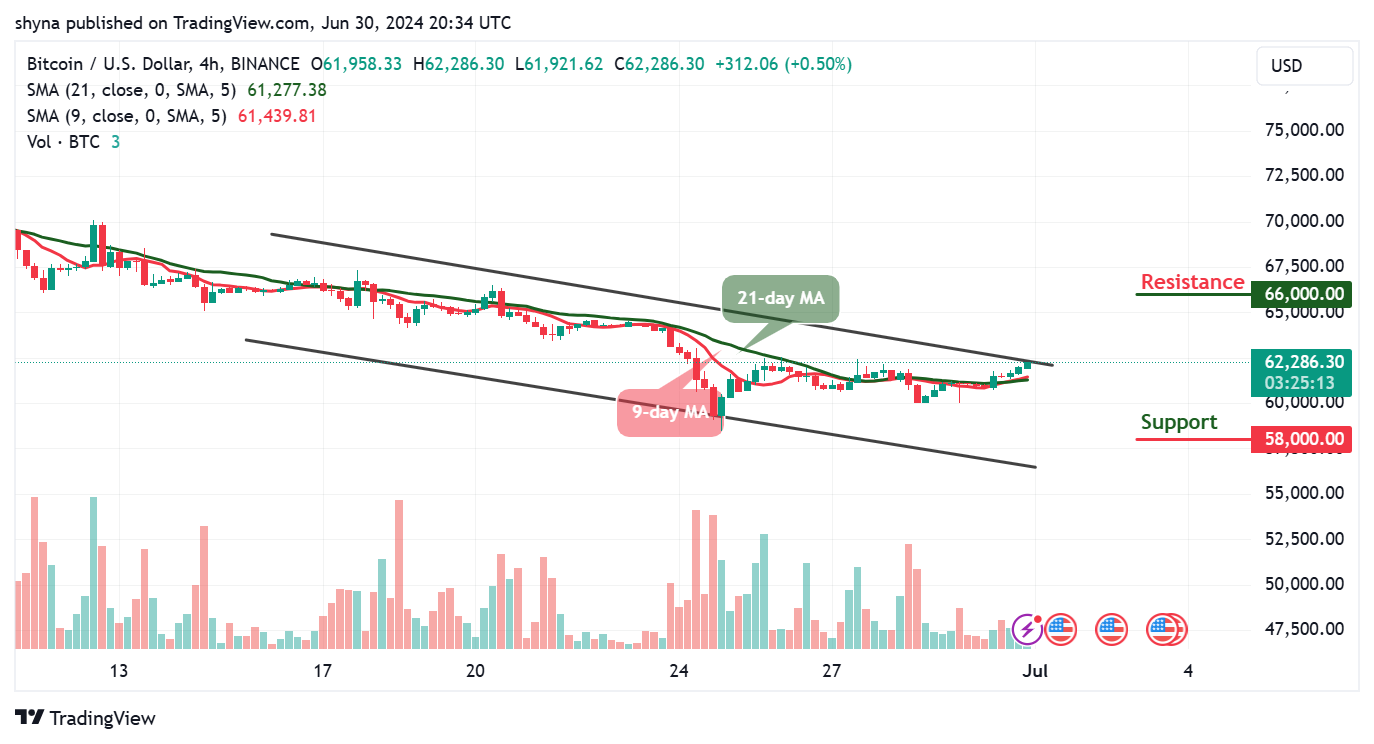
On the contrary, if the Bitcoin price breaks below the moving averages, the market price could reach support at $58,000 and below. Meanwhile, if the current market value rises and creates additional bullish movements, the Bitcoin price could hit the potential resistance level of $66,000 and above.
You can purchase Bitcoin here. Buy BTC